Our Insights

$100m Ain’t Going to Cut It

Jun 21, 2022 10:46:27 AM / by Andrew Laming posted in Debt, Action, Planning, Budget, Banking, Strategy, Graduate

0 Comments

The recent announcement in this year’s budget to provide greater support to New Zealand businesses created plenty of discussion, not least about whether or not government was equipped to be able to make a scheme like this work.   To recap, you can find an article on this here: https://www.stuff.co.nz/business/128682597/government-to-invest-100m-taking-stakes-in-small-businesses.

But one thing the debate misses, is how much of a drop in the bucket the $100m amount is and how different, subtler regulatory changes would have significantly more effect.

Take this graph of bank funding to the different sectors, since 2008. We’ve chosen 2008 as a starting point, as that was post GFC and a raft of banking regulatory capital changes emanated from this time.


Read More

The NZAB Agri & Business Banking Dashboard

Jun 7, 2022 9:57:17 AM / by Andrew Laming posted in Debt, Action, Planning, Budget, Banking, Strategy, Graduate

0 Comments

With the RBNZ recently sharing updated bank metrics for the period ending 31 March 2022, its time for us to dive back in and see what movements are afoot.

Welcome to the latest edition of our NZAB Bank Dashboard.

There's some surprising data in here - Bank lending growth continues to break records (and nearly all of it in the home loan sector) despite the changes that were implemented via the new CCCFA rules late last year.   

Agri loan repayments are accelerating and nearly all of it in the dairy sector.  At this rate, the dairy sector would repay all its debt ($37bn) in the next 14 years!

Business lending continues to have moderate growth for a 4th quarter in a row with Kiwibank making a massive charge over the last year with over 22% year on year growth in their business lending portfolio.   

The big loser in the Business and Agri space is still ANZ - they have shed 1% market share in Agri in the last 12 months and almost the same in the business sector- seemingly to lend more to NZ housing.       

Interestingly Westpac also appear to have stalled. For total loans, they're growing at half the New Zealand average and have shed a whopping 1.25% of market share in business banking alone over the last 12 months.   

As always, if you have any questions, please contact us directly.


Read More

The 2022 Dairy season in Review: Where has all the money gone?

May 19, 2022 8:25:02 AM / by Scott Wishart posted in Debt, Action, Planning, Budget, Banking, Strategy, Graduate

0 Comments

Welcome to the first in a series of articles  reviewing the financial results of the 2022 Dairy season.

At NZAB, we've got a large data set now as a result of significant investment in a data analytics platform which we use to support our clients with real time insights. We're able to use this platform to look at the trends that we are seeing in the dairy industry and provide real time insights rather than having to wait a year for the benchmarking systems to catch up.

Given most farmers are starting to think about setting budgets for next season, it's important to have a bit of a guide as to what is happening to costs so that we can make informed decisions. But it is also critical that our bankers understand what's going on here, as many covenants are set around variances on costs, many of which are outside of farmer control. 

So this first article covers our high level insights. Following this we will dive deeper into the individual trends and particular insights we take from it.

This is also an interactive series. So please get in touch with your questions, and we will publish a Q&A alongside our upcoming articles.


Milk Production and Revenue:


Read More

The Farming and Business Sectors Deserve RBNZ Action to Free Up Capital Further

May 12, 2022 8:35:43 AM / by Andrew Laming posted in Debt, Action, Planning, Budget, Banking, Strategy, Graduate

0 Comments

Information only disclaimer. The information and commentary in this email are provided for general information purposes only. We recommend the recipients seek financial advice about their circumstances from their adviser before making any financial or investment decision or taking any action.

The latest financial stability report from the RBNZ brings back to the surface a hot topic for us and our farming and business customers – that being the significantly greater amounts of capital that the RBNZ requires banks to hold when they lend to a farmer or business versus a homeowner.

The main trading banks are required to hold vastly more of their own equity capital against a farming or business loan making those loans much less profitable to make. This leads directly to less lending and higher interest cost margins in those sectors versus home lending.

We warned about the flow of capital going straight to home lending back in 2020 when the RBNZ started its “Funding for Lending” and “Large Scale Asset Purchases” programmes (i.e printing money).  You can find that article here. 

Earlier, in this article, we actively called for RBNZ to proactively make capital changes to help the New Zealand Primary Sector. 

It was clear back then that the RBNZ’s capital rules were (and still are) set up to encourage home lending and discourage farm and business lending.


So back to the latest report from the RBNZ

(you can find the full copy here)

Here are some direct quotes from that report:

“Overall, risks to the financial system from the dairy sector have diminished considerably in recent years”

“On average, dairy farmers have repaid around $3 of bank debt per kgMS in recent years”

“Total dairy sector debt has declined by around 12 percent ($5b) since its peak level in 2018”

[On the Ukraine Crisis]… higher food prices should also benefit agricultural exporters. New Zealand’s dairy and meat stocks are predominantly pasture-fed, and should fare better than overseas grain-fed competitors”

The following graph, produced by the RBNZ, best shows the significant repayments made in the sector and the strong position they’re now in.  

Read More

Strange Forces are Clouding the Fixing Versus Floating Discussion

May 6, 2022 9:07:39 AM / by Andrew Laming posted in Debt, Action, Planning, Budget, Banking, Strategy, Graduate

0 Comments

The underpinning Information only disclaimer. The information and commentary in this email are provided for general information purposes only. We recommend the recipients seek financial advice about their circumstances from their adviser before making any financial or investment decision or taking any action.


We help manage some c. $3bn of NZ Farming and business loans across NZ so we get to see the picture across all the banks and other funding sources. This gets our customers the best outcome for their farm or business funding.

With all our customers, we are continuously having discussions about managing their interest rates. In particular, this involves managing the drivers of that; the big ones being credit quality, market competition for their loans and also underlying base rate movement.

When we talk about “base rate movements”, we’re talking about the movement in swaps (being the general underpinning of a fixed rate) and the movement in the 90-day bill (being the general underpinning of a floating rate)

There’s a heck of a lot of change in both at present (check out our earlier article on the significant fixed rate differences we were observing between banks) so it’s always worth looking into some of the interesting things happening out there at present.


Case in point is this graph below.

This is a graph that shows the average of all of the four main bank’s forecasts (Westpac, ANZ, BNZ and ASB) for the 90 day bill out to September 2023 – at this point all bank’s think this will be the peak of the 90 day bill (The spread of the peak that makes up the average ranges from 3.10% to 3.60%).

We have then compared this to the swap rates for different terms from 1- 5years.

Read More

How Good is This Year’s Dairy Payout Really?

Apr 27, 2022 9:27:18 AM / by Andrew Laming posted in Debt, Action, Planning, Budget, Banking, Strategy, Graduate

0 Comments


After our last article discussing two of the larger drivers of land value change over time (payout and debt availability – you can find it here), we had a bit of discussion about the payout data going back over time.

I thought I’d just pick up on this point with a couple of graphs.

Here is our payout graph (with data sourced from LIC), which makes for interesting reading.


Read More

The Jaws of High Payout and Lowering Agri Debt Have Never Been So Wide

Apr 14, 2022 9:59:08 PM / by Andrew Laming posted in Debt, Action, Planning, Budget, Banking, Strategy, Graduate

0 Comments

As any avid reader of our articles knows, we are always interested in looking at the movement in capital in the Agri Sector - over time, between banks and also the drivers of such availability.

We do this as it helps our farmers and business owners understand how their bank ticks – essential when approaching the credit process or negotiating a new loan.

As we start to see some notable positive changes in recent sale prices for farmland, we thought it would be interesting to look back to see how the movements of some of the drivers of farmland value have looked over time - to pick up clues to what may happen next.

If you want to refresh on some of the earlier articles on this topic, take a look at the below links. It’s interesting to look back and see how some of this is playing out.

A wave of cash is about to transform the agri market

Squeeze the credit balloon and it'll pop out somewhere else

Falling Agri Bad loans give further cause for greater bank appetite

For this article I came across a really good data set* from LIC (Livestock Improvement Corporation) showing dairy land sale price and dairy payouts going back to 1978. There’s some interesting stuff in it and it starts to put some objectivity around two of the larger drivers of land value – dairy payout and bank debt availability.  

*Source data for all graphs in this article is RBNZ, and LIC reports. The LIC Reports source their dairy land sale data from REINZ. The REINZ dairy farm sales data is the median sale price per ha for that year. Some care needs to be taken with the data.   An example here is that in times of low liquidity, lower tier quality assets can make up a larger part of the pool, dragging down the median further than what it otherwise would be – but the trends are still instructive. Additionally, the data set for 2022 is only a part year data set.

First up is this graph, showing Agri debt changes versus land value since 1992.

Read More

Our Growth Story Update

Apr 8, 2022 7:58:57 AM / by Scott Wishart posted in Debt, Action, Planning, Budget, Banking, Strategy, Graduate

0 Comments

Our NZAB journey has hit a new milestone, with our 25th new employee joining us last month. It is truly an exciting time to be part of this industry, with more and more farmers trusting us to help them articulate their strategy and plan for the future.


We are still very much in growth mode across New Zealand, with key roles to be advertised shortly, so if you're interested in what we do or how we do it, please get in touch!


In the meantime, It gives me great delight to introduce to you three new staff members, plus a deserved promotion for a long standing NZAB employee.

See you out there!


Read More

Farm Inflation – a Profit Killer or a Wonderful Opportunity?

Mar 25, 2022 11:55:44 AM / by Chris Laming posted in Debt, Action, Planning, Budget, Banking, Strategy, Graduate

0 Comments

Cost creep.

Right now, it’s relentless. For the year ended Dec-21, the Consumer Price Index (CPI) was 5.9%, the biggest change since the year to June 1990. The quarter to Sept-21 was 2.2%, and Dec-21 quarter was 1.1%. Then came the oil shock.

The CPI is made up of the theoretical cost of a bunch of staple goods and services that a household will need to purchase. It includes, food, utilities and services, energy, transport and housing among other things.

The biggest culprit referenced in the December numbers were, unsurprisingly, housing related costs. Within that bundle were rents (up 3.8%) and Housing construction (up 16%). Drivers for this increase in construction costs were cited as supply-chain disruption, higher labour costs, and higher demand.

The second largest contributor was transport related costs, lead by increases in petrol (up 30%) and second-hand cars (up 12%).

And then, there’s of course the Russian Ukraine conflict. Ukraine, known as Europe’s bread-basket. And Russia with its countless litres of oil. These are significant economic changes happening right before our eyes.


So what?

Farmers have long known about the connection between inflation and interest rates. Particularly our farming clients that started their careers in the early 2000s and experienced inflation and rising interest rates over this time. Pre-GFC, the Official Cash Rate (OCR) got as high as 8.25% before Lehmann Brothers fell, bringing the world’s financial system with them. Up until then, at every OCR announcement, I remember Allan Bollard clutching the Lectern and adding yet another 25 basis points to the OCR, knowing that meant another corresponding lift to floating rates.

Read More

Hope for the Best - and Plan for the Best

Mar 14, 2022 11:12:12 AM / by Tom Laming posted in Debt, Action, Planning, Budget, Banking, Strategy, Graduate

0 Comments

This is a quick note after reading the results of the latest Federated Farmers confidence survey.   

You can find it here.

I found the outcomes fascinating.

In summary:

  • There was a 10.1% decline in farmers who considered current economic conditions good
  • A net 64% of farmers believed general economic conditions would deteriorate in the next 12m – a 25% decline since the July-21 survey

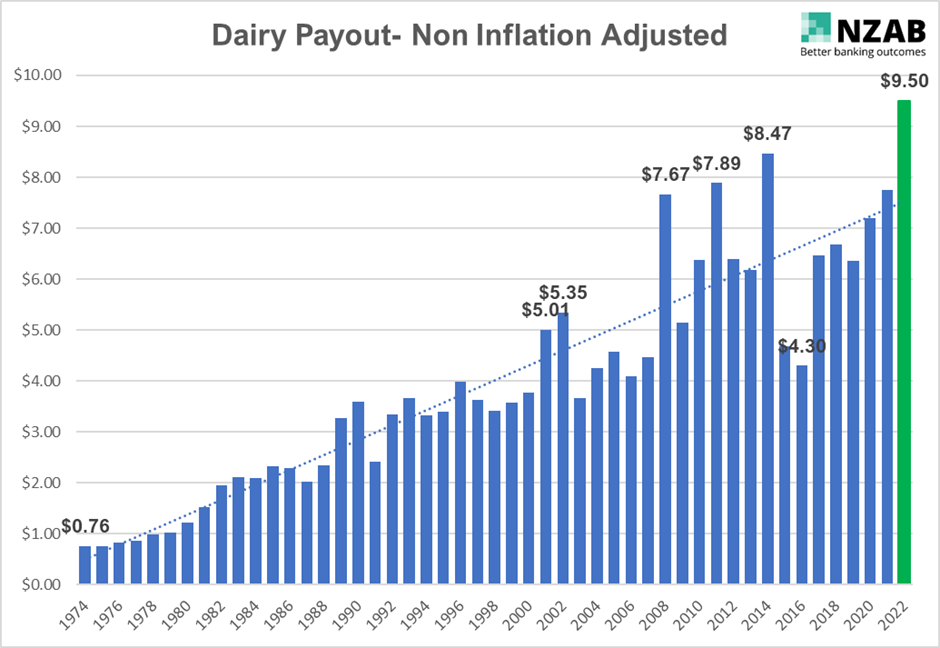
These results are in an environment where milk futures for FY23 just topped $10, lamb and beef returns are strong and global wheat prices just increased 40% in a week!

Whilst it is important to recognise the impact of inflation on operating costs, the ongoing issues in the labor market and continued influence of regulatory requirements (not to mention the threat of escalating war in Eastern Europe), one could argue that from a profitability perspective we have rarely seen things so good.

Yes, history says that the usual fix for high prices is high prices, and that the higher the high the more precipitous the fall.

But what if prices don’t drop? What if this period of high commodity prices is sustained (and in fact we have been through a period over the last 3-4 years of minimal volatility and general upside)?

I think it’s an interesting thought process to go through to test what your business would do strategically (and maybe operationally) should high product prices be sustained.

That could well be nothing different – pay down debt, pay a dividend, reinvest on a as needed basis…..or could it mean that certain elements of your strategy are accelerated or reshaped?

Is this the time to bring forward infrastructure spending? Is this a great opportunity to investigate and invest in environmental management and mitigation? Could you bring forward elements of your succession process?

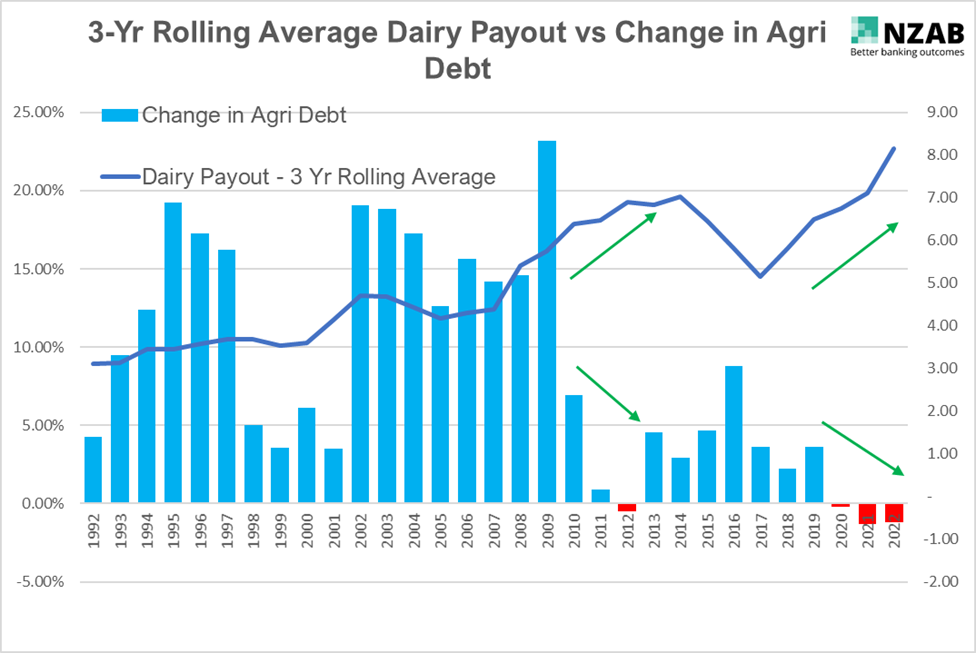
History says that not only do higher commodity prices lead to better profitability, they also get capitalised into land values. What would an improving balance sheet mean for your business and your decision making?

It seems to me that if we were staring down the barrel of lower product prices, we would be focusing pretty hard on business strategy in order to manage through that period.

So why not flip that and do the same sort of process, but through the lens of sustained higher price? The old saying says “hope for the best and plan for the worst”.

Let’s flip that and “plan for the best….and plan for the worst”! There will be nothing lost and everything to gain by making sure you position your business to take full advantage of the current tailwinds in profitability.

I would say the process would be great for improving your confidence levels too! 

Read More