
As any avid reader of our articles knows, we are always interested in looking at the movement in capital in the Agri Sector - over time, between banks and also the drivers of such availability.
We do this as it helps our farmers and business owners understand how their bank ticks – essential when approaching the credit process or negotiating a new loan.
As we start to see some notable positive changes in recent sale prices for farmland, we thought it would be interesting to look back to see how the movements of some of the drivers of farmland value have looked over time - to pick up clues to what may happen next.
If you want to refresh on some of the earlier articles on this topic, take a look at the below links. It’s interesting to look back and see how some of this is playing out.
A wave of cash is about to transform the agri market
Squeeze the credit balloon and it'll pop out somewhere else
Falling Agri Bad loans give further cause for greater bank appetite
For this article I came across a really good data set* from LIC (Livestock Improvement Corporation) showing dairy land sale price and dairy payouts going back to 1978. There’s some interesting stuff in it and it starts to put some objectivity around two of the larger drivers of land value – dairy payout and bank debt availability.
*Source data for all graphs in this article is RBNZ, and LIC reports. The LIC Reports source their dairy land sale data from REINZ. The REINZ dairy farm sales data is the median sale price per ha for that year. Some care needs to be taken with the data. An example here is that in times of low liquidity, lower tier quality assets can make up a larger part of the pool, dragging down the median further than what it otherwise would be – but the trends are still instructive. Additionally, the data set for 2022 is only a part year data set.
First up is this graph, showing Agri debt changes versus land value since 1992.
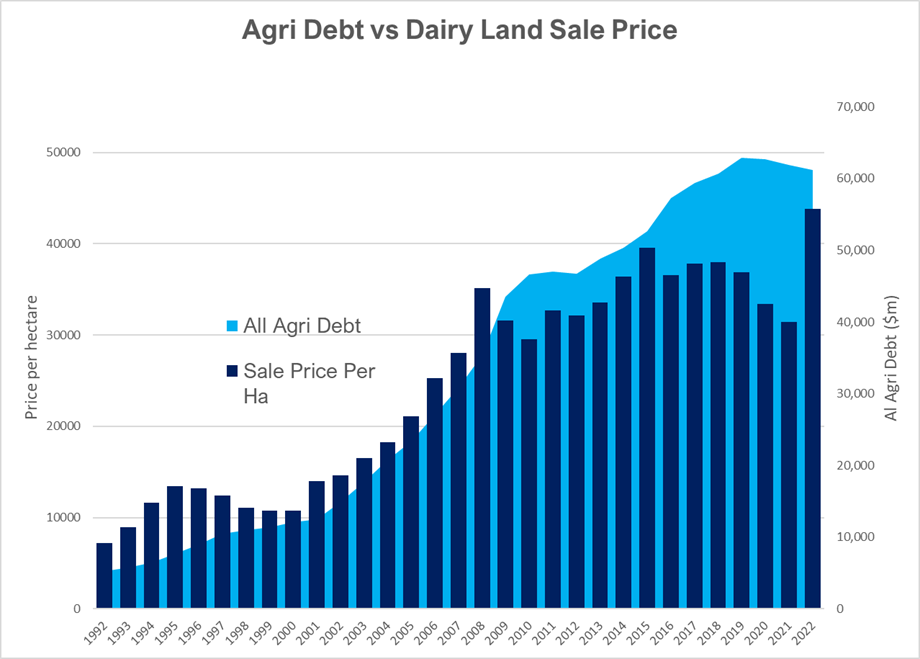
Perhaps unsurprisingly, there is a very strong correlation between the amount of Agri Debt in the sector and land value change.
The more debt in the system there is, the higher price of land!
The period from 2001 to 2008 is most notable for this, and also 2012 to 2015, before the dairy downturn hit.
From 2015, the trend is less obvious but still there. This time heading down and somewhat lagged. In 2015- 2017 Agri debt was still rising rapidly (a by product of funding cash losses through this time), before the Agri debt starts to come down and with it, the land value, from 2018- 2021. This is despite the very good and growing profitability through this period.
As an aside, look at the whole decade from 2010-2020 – land would appear to have not been a very good asset (noting the limitations with the REINZ data). But it was a game of two halves – anyone that went 2010 to 2015 enjoyed great returns, however the second half was decidedly average.
Note the last column, which is counter to anything we have ever seen before in Agri (in this data set). I’m not talking about the step up in land values – more so that it’s happening when Agri Debt is falling, not growing which is counter to historical movements.
To support that point, take a look at the next graph:
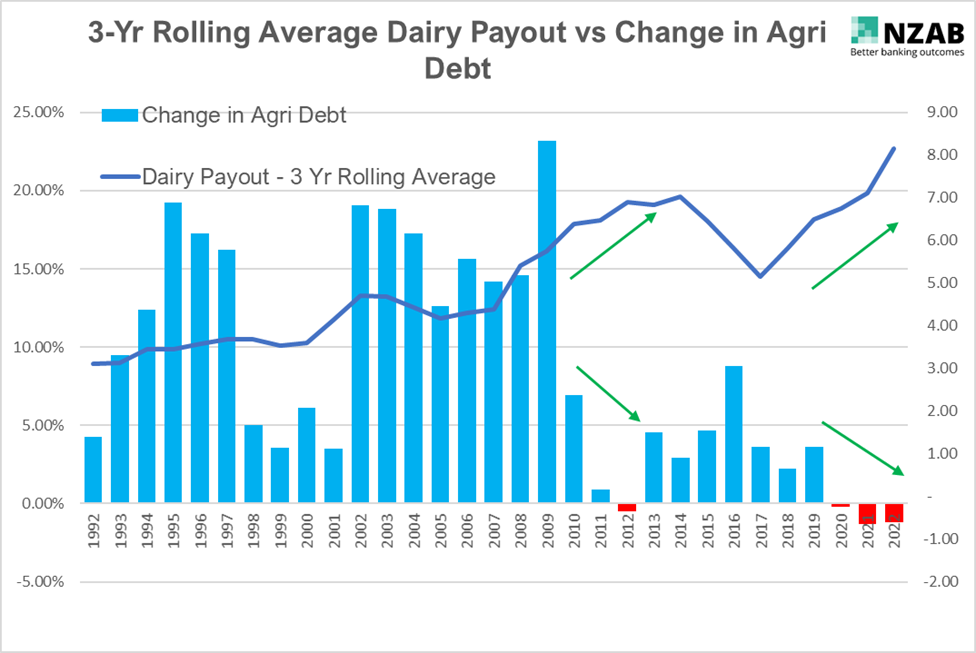
It’s clear from history that high payout has previously been a feature of increasing Agri Debt, not falling Agri Debt.
This is by virtue of higher payout driving more investor confidence which equals more expansion and investment at higher prices with banks supporting the rush.
However, the last period from 2018 is of significant fascination to us as the “jaws” (green arrows on graph - payout increasing, sector debt dropping) are now widening again, just like they did in 2010-2012 post the GFC. Looking back at that period we saw a sustained increase in land value in the following period of 2012 to 2015 (see next graph below).
And those jaws are wider than have ever been seen before.
And one more graph to round this out, below is the entire change in sale prices of dairy land since 1978 with payout alongside (check out the payout in 1978 – 79c a kg!).
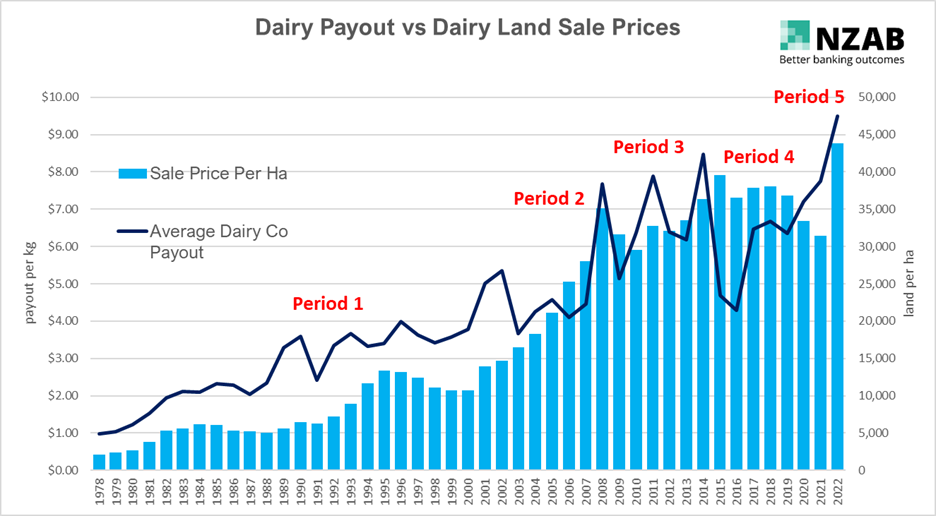
Period 1 is steady as she goes – I haven’t dived too much into this period from 1978 to 2000, but generally land sale price rises and flattens (and sometimes falls a bit) with payout. That said, it would be interesting to look back in detail here one day (given the high inflationary period in the late 70’s and into the 80’s and a similar occurrence right now).
Period 2 was the first milk powder boom in 2007/8 and with it came higher payout. This resulted in more Agri debt and a steep jump in land values.
Period 3 was the short sharp hit of the GFC. It certainly didn’t feel short at the time but history actually proved that to be the case with land values returning on their merry way upwards, reaching an all-time sale price high in 2014/15 (2022 aside for a moment).
Period 4 is where things really fell apart in the dairy sector with back-to-back ultra-low payouts although impact on land value didn’t really start to bite until 2019.
Period 5 this is today with the part data year from LIC/ REINZ – Dairy Land sale prices now finally increasing after three years of sustained good payout, including a record payout this year
So I’d like to wrap up a with a few thoughts:
1. Develop your own View
There are notable historical trends in respect to the correlation between changes in payout, Agri debt and land value. Whether these trends will continue into the future is up to an individual’s view. Historical performance is not always the best proxy for future expectations, particularly in a much different world than what was back then.
2. Always keep a keen eye on the flow of capital
Capital availability from an Agri perspective is much freer than it was even 12 months ago. Combined with farmers having ongoing good cash performance, banks are also opening up their door further. Both are supportive of further capital the sector. But the flipside is true too, so look out for the signs of change as well. The home loan sector is a current example.
3. There are many more drivers of land value aside from just Agri debt availability and dairy payout
Payout and availability of Agri debt are only two of many drivers on land value, albeit very large ones. There are many other impacts not discussed here including the changing capital requirements in banks, environmental considerations, scarcity of suitable management and large global events. All of these need to be factored into your thinking.
However, the data above is interesting and we hope it leads to greater understanding on some of the forces at play in land value and how banks may react in the future.
We would also welcome your own thoughts and interpretation of the data presented here.
Who is NZAB? 
Farming’s very complex and you can’t be an expert in everything. That’s why the best farmers gather a specialist team around them. Our specialty is better banking outcomes for our clients.
There’s no one better to work alongside you and your bank. With a deep understanding of your operation and our considerable banking expertise, we can give you the confidence and control to do what you do best.
We’ve been operating for five years now and we’re right across New Zealand, For an introductory no cost chat, pick up the phone and talk directly to one of our specialists on 0800 NZAB 12.
Or if you prefer, Visit us at our website or email us directly on info@nzab.co.nz
