
We’re having a lot of discussions at present with our customers about fixing interest rates given the increase in rates via recent OCR changes plus expectations of further rate increases which are being forecast by most economists plus the RBNZ.
We’re also seeing those expectations being played out in the swap curve, where 5-year swap rates have moved from historical lows of around 0% to a peak of c. 2.8% recently.
This has led to plenty of discussion about the merits of fixing versus floating.
This short article is not about the merits of fixing versus floating (we will outlay some considerations on this topic in an upcoming article), but to highlight a significant discrepancy that we’re seeing between banks at present with their various fixed rates, even when standardised back to the same customer margin.
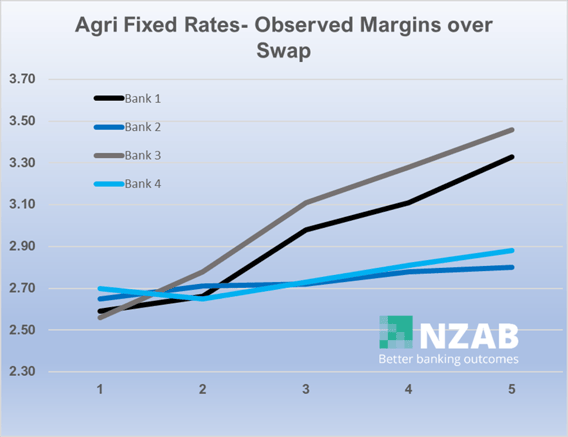
Take a look at the below graph, which is a data set of four of the main banks depicting the margin above the swap rate for each term of 1-5 years.
Now, its important to note a couple of things here:
- This is based on a customer base margin of c. 2.5 above a typical BKBM for illustrative purposes only. We observe plenty of margins both higher and lower than this.
- The colours of the graph are meaningless versus the normal colours of the main banks.
- This is only one data point and only one consideration out of many when discussing and then agreeing on an interest rate risk management strategy.
The numbers are extremely stark.
At 1-2 years, most banks adopt similar margins above the swap curve as each other.
However, when we move to 3-5 years, two banks in the market place have significantly higher margins inserted in their 3-5 year rates than two other banks.
At their broadest gap – the 5-year rate, those margin differences are as much as 65bps. To put that in context, that means $6,500 per year per $1,000,000 locked away.
That means $32,500 over 5 years.
If it was a $10m loan, that would be $325,000.
That’s an extraordinary amount of money. That premium, above and beyond the market, does nothing to manage your risk.
So why is this?
Well, a number of things can cause this, but the major reason is the different banks’ views of the relative uncertainty of future required margin changes that they might need to make if your credit risk changed or RBNZ capital regulations changed.
When a bank locks in a fixed rate with you as a borrower, the margin and their return with it is generally locked in for that period of time.
If the amount of bank capital that they hold against your loan needs to change in the future (due to credit risk or regulatory changes) and that impacts on their return on equity, then they can’t do much about that if there is a fixed margin in place.
So, it becomes a bit of a guessing game with bank’s attempting to manage this with various margin buffers and views on what the future may hold.
In other words, they’re managing their own risk at the same time, by transferring that risk onto borrowers.
Clearly some banks have a much different view of that future than others.
Historically, we don’t typically see such a big difference between banks across the terms but given the big gap opening up and customers looking to make fixing decisions right now, we thought it would be useful to point this out.
So - whose risk are you trying to manage when you fix yours or the banks?
This should not be a deterrent to making a fixing decision – as we said earlier in this article, this is only one data point and only one consideration out of many when discussing and then agreeing on an interest rate risk management strategy.
If you want to chat about any of this, drop us a line.
