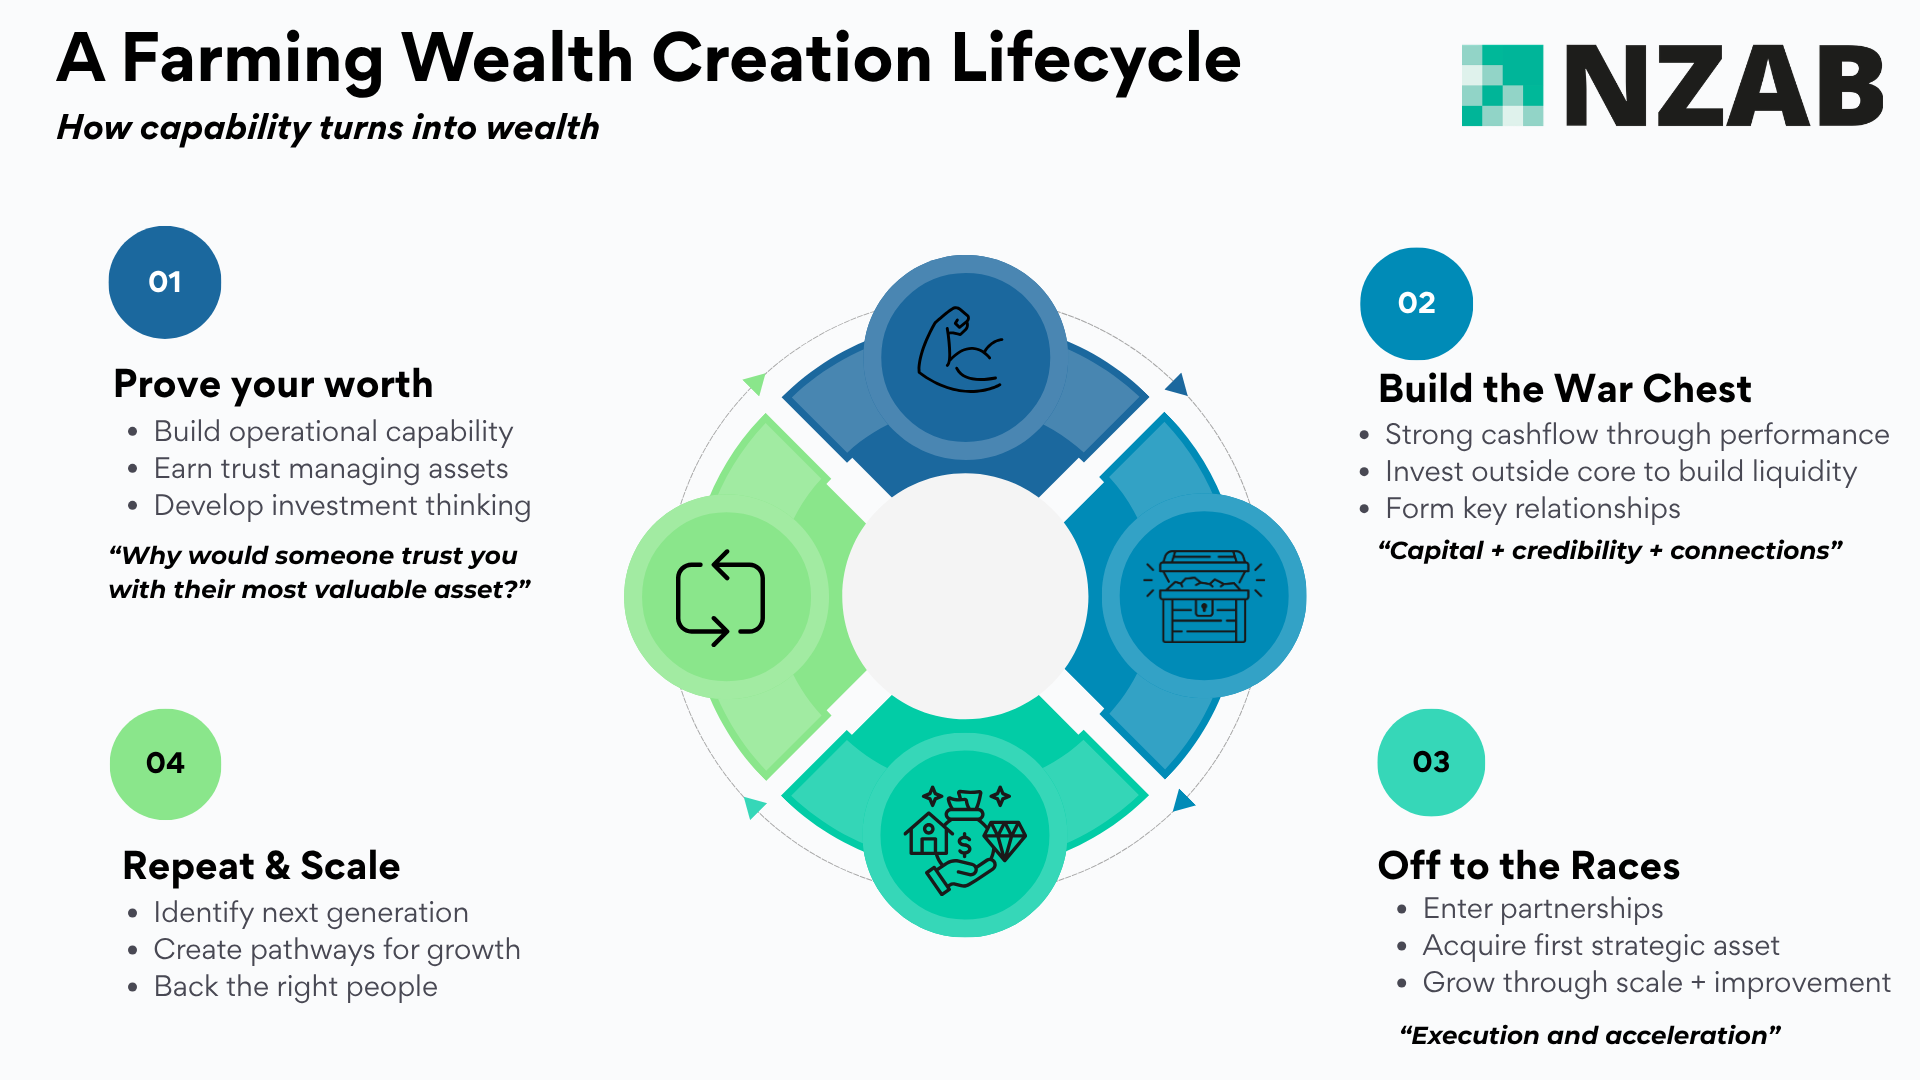
Capital, Confidence, and the Question of "What's Next?"
Information only disclaimer. The information and commentary in this email are provided for general information purposes only. We recommend the recipients seek financial advice about their circumstances from their adviser before making any financial or investment decision or taking any action.
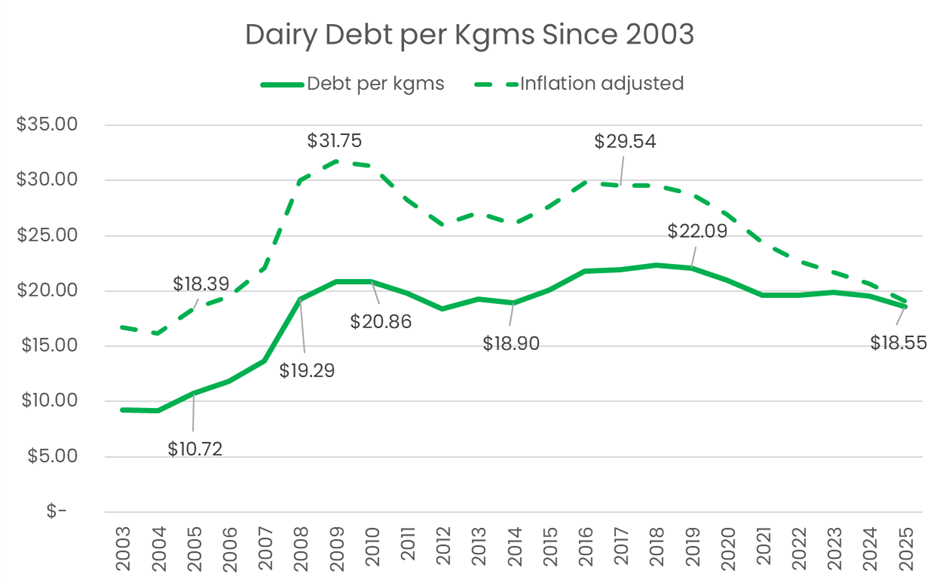
The New Zealand dairy industry finds itself in a position that would have been hard to imagine not that long ago. Balance sheets are strong. Cashflows are robust. Debt levels, in many cases, are trending down faster than bankers expected. Payouts have been solid, and the upcoming Fonterra capital distribution is adding another meaningful injection of liquidity into an already well capitalised sector.
On almost every traditional financial metric, dairy is in a position of strength.
And yet, beneath the surface, there is a growing sense of tension, not from stress or distress, but from abundance. When capital is plentiful, confidence is high, and opportunities feel scarce, the real challenge becomes strategic, not operational.
This is where the industry is right now.
A Sector Flush with Capital and Optionality
Most dairy businesses today are operating with strong free cashflow. Years of discipline, improved productivity, and favourable pricing cycles have created a cohort of farmers and owners who are not just surviving but thriving. Debt repayment has accelerated. Working capital buffers are healthy. In many cases, businesses are carrying less leverage than they have in decades.
Interestingly, this strength is now creating a new dynamic with lenders. Bank confidence in the sector is extremely high. Many bankers quietly admit they are more concerned about too much debt being repaid than too little. From a portfolio perspective, dairy exposures are shrinking faster than forecast and that brings its own pressures around balance sheet growth and targets.
This is a rare position for any industry to be in: where lenders are supportive, capital is cheap and available, and risk appetite is strong.
The question is, what do you do with it?
The Scarcity of Dairy Opportunities and the Fear of Missing Out
At the same time, there is a noticeable lack of available dairy assets coming to the market (or more accurately, the fear of). Properties that do come to market attract strong interest, are fiercely contested, and often attract multiple motivated buyers in unconditional positions. Each tender feels like it might be the opportunity and missing out can create a quiet but powerful fear of falling behind.
This scarcity is driving behaviour. It’s encouraging people to stretch, to compromise, or to wait uncomfortably on the sidelines with capital that has nowhere obvious to go. For an industry built on land ownership as the primary wealth engine, the lack of acquisition opportunities creates frustration and strategic paralysis.
Yet scarcity can be a signal, not just a constraint. It often marks the point where the next phase of growth looks different from the last.

.png)