Information only disclaimer. The information and commentary in this email are provided for general information purposes only. We recommend the recipients seek financial advice about their circumstances from their adviser before making any financial or investment decision or taking any action.
We’ve dived back into the RBNZ data to see all the main bank movements over the last six months- all the changes in lending, who’s winning market share and who’s losing it- in both the Agri and Business Lending Sectors.
In this Issue:
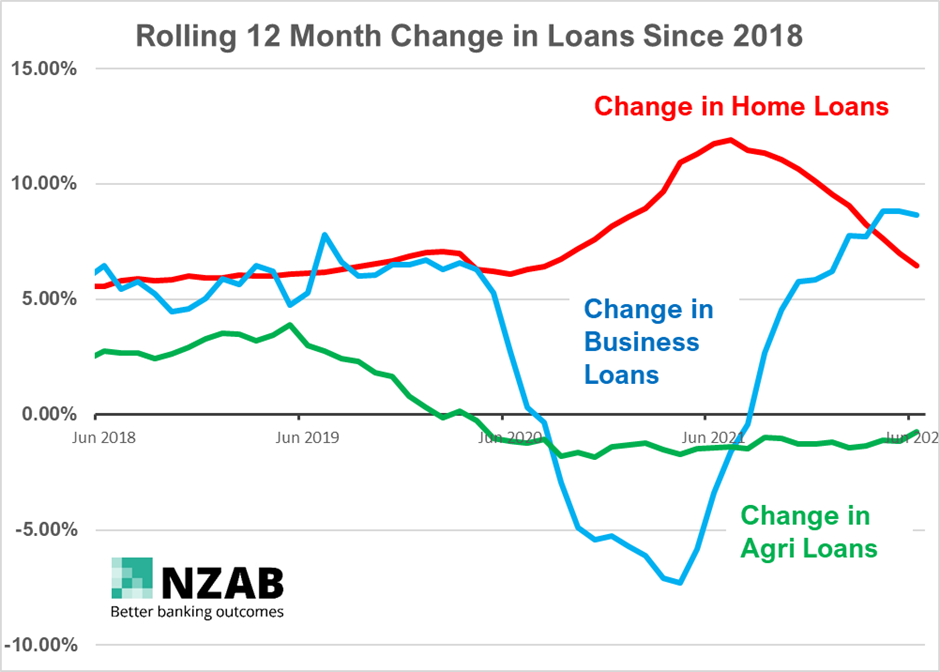
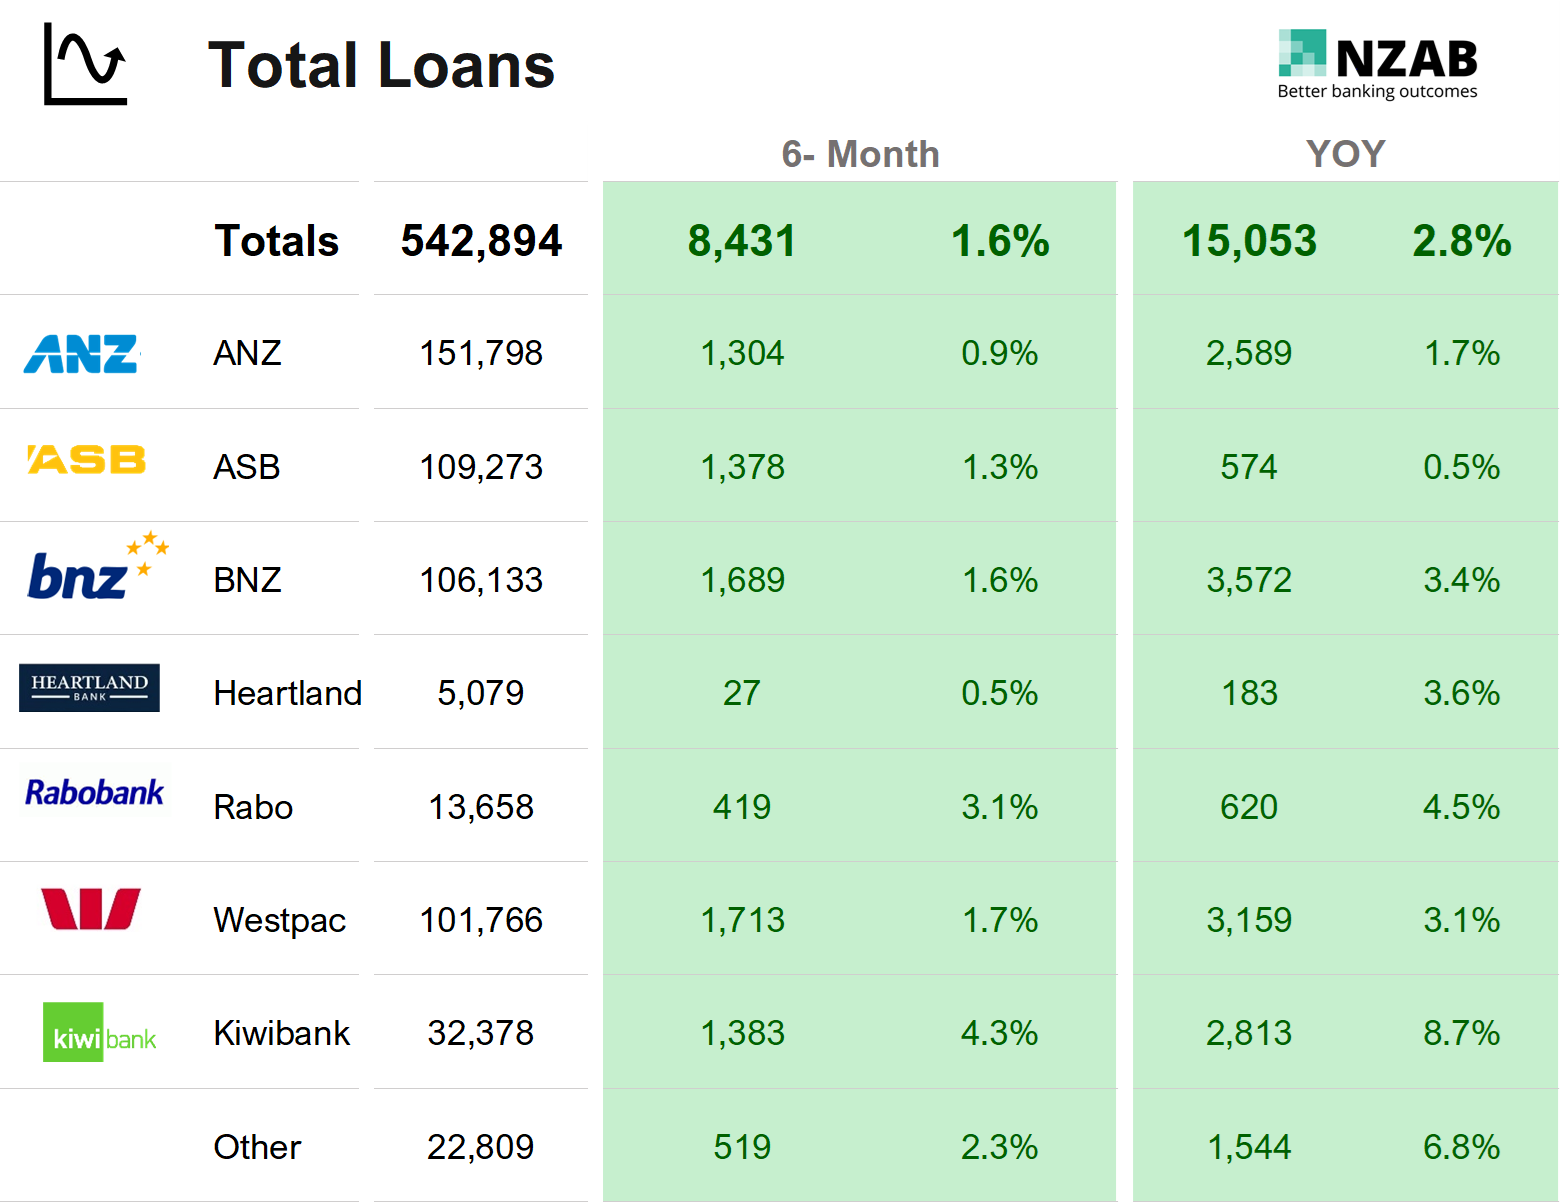
- Whilst the growth in total loans continues for all NZ banks, it remains quite anemic, a continuation of the slowing in credit growth that started in late 2022, but huge overall growth for Kiwibank with 8.7% growth
- Westpac Agri lending is lagging the other banks, (even ANZ, who continues to drop) with its' Agri loans reducing by $350m for the year, resulting in a market share drop of 60bps. Rabobank was again the benefactor, picking up 75bps of market share.
- ANZ shed a whopping $1.6bn in business sector loans over the last 12 months - one of the biggest retractions in lending over a period we've seen. ANZ now has less business loans than what they had in 2020, and over $2bn less in Agri loans, However, during this time, they have increased their home lending by almost $20bn
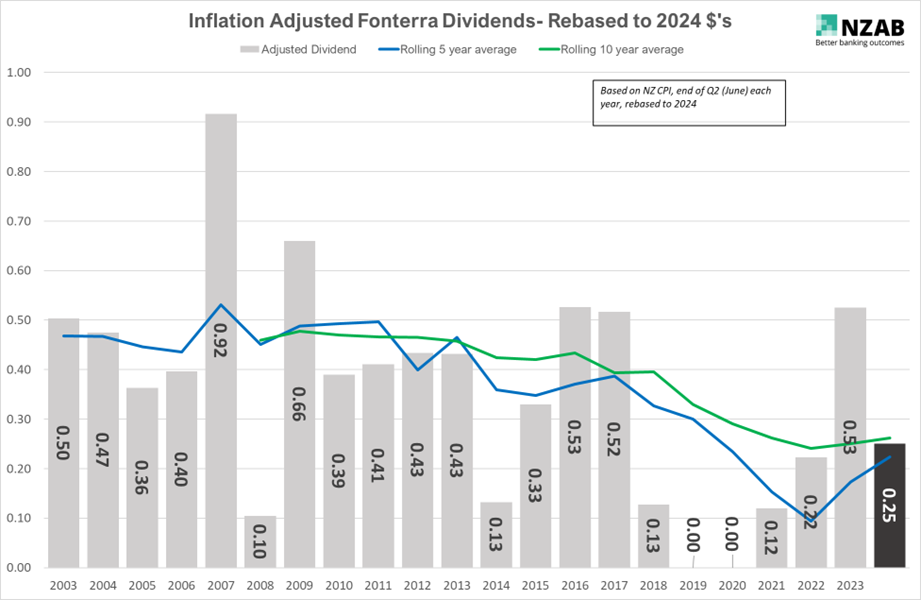
- Dairy loans continue their ongoing repayment profile, reducing by over $500m for the year, going some way to explaining the strong demand for loans in this sector.
- Horticulture loans continue to grow substantially, up a further 8% for the year despite Agri loan growth being largely flat.
- Agri non-perfoming loans and lending provisions were largely flat over the year - this is likely to be the balancing of risk between an improving dairy situation, but a sheep and beef sector that remains under pressure. Additionally, the viticulture sector was under some earlier concerns which has now alleviated somewhat, similar to that in the Kiwifruit sector
As always, please sing out if you have any questions or would like to use the data in your own presentations or engagement with customers. We would be happy to provide a digital version for sending.