 Predicting the future isn’t easy and “anyone that tells you that they know what’s going to happen is either lying or they don’t know what they’re talking about” (*Warren Buffet).
That said, how people feel about the future based on their observations right now is really interesting and it can tell us a lot about what will play out in coming months.
Survey’s are a good way of examining these trends
One survey we watch really closely is the RBNZ Credit Conditions Survey, published bi-annually.
This survey is relatively simple - the RBNZ asks banks what they expect both the demand and supply of credit in each of their lending sectors (residential, consumer, SME, Agri, Corporate) will be over the next six months and what they've observed over the last six months.
They are sentiment-based questions but given the banks do control the strings of sector capital availability, its pays to take notice.
There’s a bit of data in the survey, but the subset that describes things best is the rolling three year average of credit availability - in other words- how does credit availability stack up today verse three years ago as a trend line.
We’ve taken that data and put it into the graph below - the results are starting to show some very stark trends between the different sectors which are worth paying attention to.
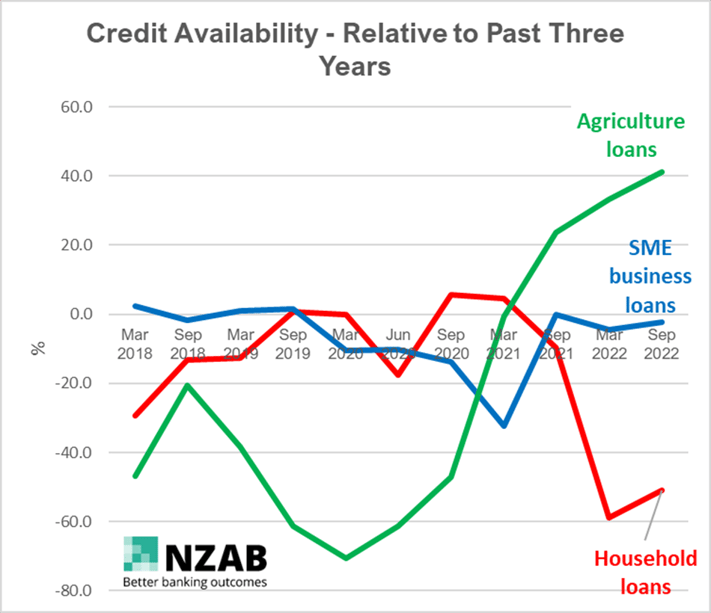
Now, it’s important to note that these trends in credit availability don’t necessarily transpose into increasing net loans to each sector. Case in point, lending volumes in the home loan sector are still growing as of last month and agriculture loans are still flat.
But more so, it’s a gauge of the banks' desirability of where the next dollar will go, based on a whole lot of factors – sector confidence, credit quality and portfolio mix to name a few.
Taking those factors combined, the banks are expecting an almighty slow-down in credit availability in the residential sector - and conversely - a significant availability in the agriculture sector.
Now, let’s compare this to actual observed demand in other words, which sectors are actually kicking down their banks’ door for more loans so we can see if the trends are evenly matched – see below graph:
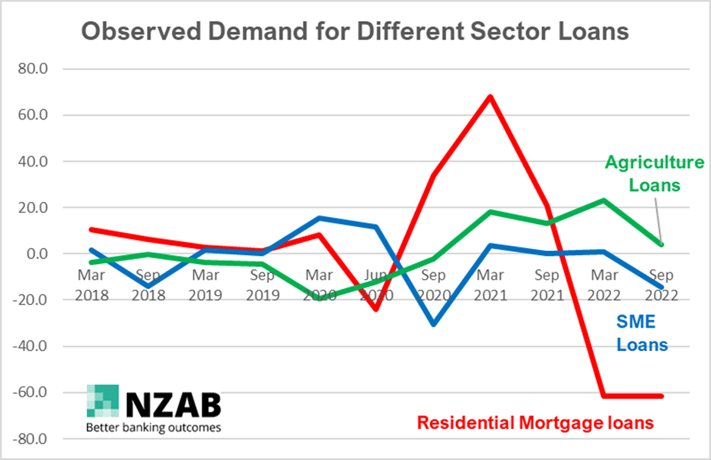
Residential and business loan demand matches their expected lower supply, so nothing startling there.
However, agriculture loan demand is falling at a time when the longer-term trend of credit supply is increasing.
Furthermore, the agriculture loan demand line is falling even further than the above graph (the survey also tells us that next six months expected demand for Agri loans is lower still) – a symptom of higher interest rates and regulations impacting confidence, but also strong profitability resulting in elevated loan repayments. This a notable mismatch between changing supply and changing demand.
That mismatch is starting to play out in the market where we are seeing very active competition for agriculture loans again. We’re going to cover this topic in a separate article and talk about what to look out for, what the implications of changing appetite are and how to ensure you set your business up well on the back of it.
Understanding the see-sawing nature of bank appetite is critical when making longer term investment decisions that cover many different credit cycles.
In the meantime, take a look at this final graph showing what factors are causing the general slowing of the availability of credit.
The survey asks the banks (and by default their customers) what things are the biggest detriments to the change in credit availability.
We’ve formulated this data into the bar chart below which shows the change in those factors over the last 12 months that are impacting on credit availability. It’s telling they’re all in negative territory- bar a very small glimmer of positivity in bank competition increasing.
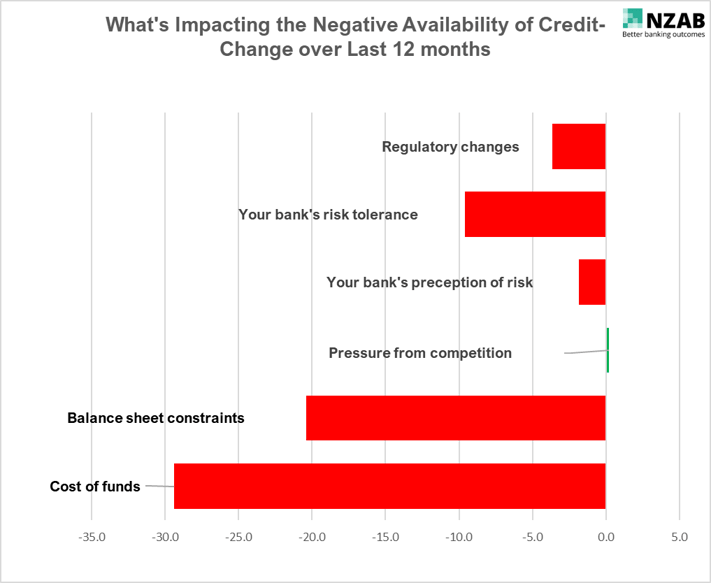
There’s probably no surprises in the above data, although that last factor – the cost of funds- is significant from a future inflation perspective. It shows how acute the rising cost of interest is on negative demand for credit. When this flows through into reduced spending (it will) and by how much, is still yet to be seen.
Whilst “regulatory changes” shows a smaller negative change in the last 12 months- when we look at this over the last 24 months, this is a much larger 28.3% negative swing. This is good if you think regulation is necessary to curb runaway lending but conversely the question then becomes - has this gone too far?
That’s a question that will only be answered in time when we look at future credit growth.
Who is NZAB?

Farming’s very complex and you can’t be an expert in everything. That’s why the best farmers gather a specialist team around them. Our specialty is better banking outcomes for our clients.
There’s no one better to work alongside you and your bank. With a deep understanding of your operation and our considerable banking expertise, we can give you the confidence and control to do what you do best.
We’ve been operating for over five years now and we’re right across New Zealand, For an introductory no cost chat, pick up the phone and talk directly to one of our specialists on 0800 NZAB 12.
Or if you prefer, Visit us at our website or email us directly on info@nzab.co.nz
