
Information only disclaimer. The information and commentary in this email are provided for general information purposes only. We recommend the recipients seek financial advice about their circumstances from their adviser before making any financial or investment decision or taking any action.
That headline might get a few replies to my inbox. To add fuel to the fire, I need to be clear that I’m not an economist.
However, with the unprecedented volatility we’re seeing with both inflation and the resultant interest rates hikes designed to kill it, understanding the mechanics of inflation is critically important to establishing an informed (and not emotional) view on where interest rates might go.
In this article, I want to talk about how inflation is measured and the indicators that are used. Plus, I want to discuss some of the flaws in the current approach which may lead into some of the unintended impacts that are going to be with us for years to come.
Why is this important?
It seems that both current inflation levels and the central bank response to it is like a large rubber band at present. The further it gets stretched away from the middle, the bigger the impact when it lets go. We’ve seen the impact of the far too loose monetary policy to date.
Are we set to see the pendulum swing too far again, but this time the other way?
Ok, first lets school up on inflation.
Inflation, broadly occurs when demand for goods and services in the economy outpaces supply.
Without going into detail, we all know that too much of it is a bad thing. It’s colloquially called “the thief in your pocket”.
Get it right and it means households and business can have normal stable activity Get it wrong and it can lead to all sorts of market distortions and erratic behaviour for both business and consumers.
Ultimately, a very high inflation rate puts a dent in the trust that people have in money – if people think it’s not going to be worth a similar amount in the future it starts to lose its “trust”.
Noone wants that to happen.
How is it calculated?
Inflation is calculated by examining a “basket” of goods and services and how they change in price over time. This might be food, petrol, rent or consumer electronics. This data is collected by Stats NZ and presented as a CPI index. At the moment, its running at 7.2% well above the mandated band of the RBNZ of 1-3%.
Issue one: CPI is measured over a 90-day period (quarterly) and looks backwards.
We’ve just been informed by Stats NZ in late January, that CPI for the quarter ending December 2022 was 7.2%. That’s all of the spending change in October, November and December last year.
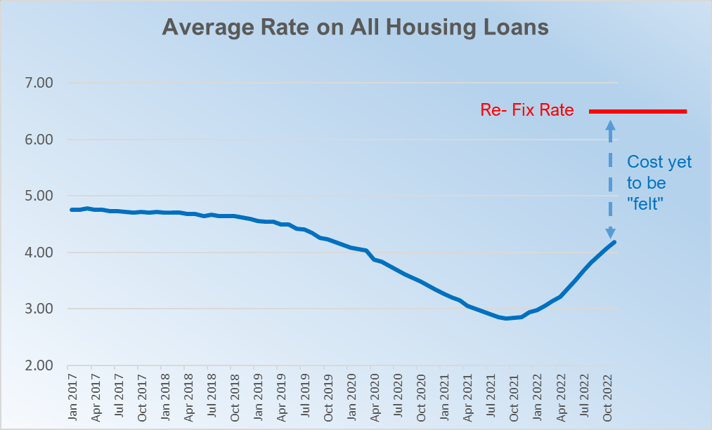
In October last year households were paying an average of only 4.07% on their home lending (due to still having fixed rates in place – see more on this below). Household savings were still semi-high and Adrian Orr hadn’t delivered his November monetary statement reprimanding public spending and talking of significant further increases in rates.
In other words, people hadn’t changed much at this point.
In other countries such as the US, CPI is measured monthly - we think adopting this system would be a very good start.
Issue two: CPI doesn’t record change of volume of spend - only a change in price.
What’s really interesting about the calculation methodology is that it measures the changes in price of particular goods or services, but it doesn’t measure the change in volume of how many or how much we’re purchasing them for. They are weighted, but that weighting only changes every few years.
For example, if food prices (which make up ~19% of the index) go up for the year by 10% but we all collectively spend 10% less because we can’t afford as much (meaning purchasing volume goes down), this registers as a 10% increase in inflation (for that category) even though we may have spent the entire amount.
Now economic theory solves for this – i.e if we are all start buying less of something that costs more, that, “in theory”, with all else held equal, might lead to a build-up of stock of that item which would then mean that prices would go down to bring supply and demand back into equilibrium *
But that takes time to work through- again, “a lag”.
(* this statement is not entirely correct when it comes to food at present – as inventory itself won’t build if the actual supply has reduced – which is currently the case with food due to Covid issues and geo-political supply line disruption)
Issue three - fixed rates - average interest rates on home loans are still low (but rising fast).
About 50% of all fixed rate loans will come off this year.
At the moment (as of Nov 2022), the average rate being paid given a mix of historical fixed rates, is still only 4.07%. We estimate it is probably about 4.50% by the end of January – but that is still a mile away from the current short term re-fix rate of 6.50%. In short, the pain and impact on spending in the economy is still coming and set to intensify.
Given the high use of fixed rates by New Zealand homeowners, albeit quite short in length (1-3 years), you could effectively put up the OCR to 10% and it wouldn’t make much difference to how much a homeowner is paying on interest right now.
This comment is an extreme example, as it would definitely have the impact of scaring the population into spending less due to fear of the future – but the point is that it takes time for the increase in OCR to work its way into actual spending habits. You must be patient to see its effects as it flows through the fixed curve.
However, the impact is happening much quicker in farming and in business where loans are typically more likely to be floating commercial type products and they see the rises everywhere, the 30 or 90 day bill goes up. They are feeling it sooner.
So, in summary:
We have OCR decisions being made using a period of time that has well passed, using methodology that doesn’t fully capture peoples reducing spending habits, that don’t even have an impact on the wallet until sometime in the future!
The lagged nature of this system is actually quite startling. We probably haven’t cared about it prior because we’ve never seen such quick or dramatic shifts in inflation. It simply wasn’t that volatile.
Why can’t we look at lead indicators more?
Lead indicators are very useful and we’re certain that RBNZ looks at them. They include measures such as business and consumer confidence survey’s as well as surveys about firms own expectations about inflation (a relatively useful guide about their expectations for what they might have to pay for items in the future).
The current consumer and business confidence surveys are dismal and in some cases at the lowest levels yet.
Whilst lead indicators are very useful and will no doubt temper how the RBNZ think about future inflations and interest rates, they are expectations, not actual data. Until they translate into actual inflation rate change, it becomes more difficult to rely on.
RBNZ’s ability to see through all this and the nuance of signaling.
The RBNZ know all of the above factors, plus they have data availability and insights far in excess of what we can canvas from the data.
However, what is concerning (or actually comforting, depending on your view), is the bloody-mindedness of the RBNZ to see inflation back to the band. In part, this is due to their explicit understanding of how destructive out-of-control inflation can be, but we also suspect this is in part due to recent events. For example central banks around the world were so widely panned for their management of monetary policy during Covid that they were ultra-determined not to be on the wrong side of monetary policy this time around. “The path of least regrets” is a phrase commonly used by the RBNZ.
Also, there is an element of nuance with how the RBNZ provides guidance to the market.
When I was a young banker starting out over 20 years ago, Don Brash RBNZ Governor at the time, was an advocate of “carrying a big stick but not using it”. In other words, the mere signaling that interest rates would go up in the future would force consumers to change their habits now, which if they did would actually mean the said interest rates wouldn’t have to lift. By golly, our current RBNZ Governor is carrying that big stick well now!
Another analogy is the way a bank might deal with an errant customer who they perceive is overspending.
At first, they might gently signal that they’re concerned with that business’s spending (or profit levels), then they might decline an increase in their OD limit. If nothing improves, then they may even reduce the OD limit, or worse ask for the money to be repaid. The response and action escalates in the face of unapparent or protracted time for the required change in business performance – so the issue might not be the business performance, but a disconnect in the speed of the change required.
What are the impacts of “overcooking” this?
Quite profound and far reaching.
Ultimately when consumers spend less, it means less business profit which leads to inventory building/ business re-sizing which can then eventually turn into discounting to turn that to cash, which leads to lower business profits which leads to cutting jobs – which reinforces the first part about spending less.
Ultimately that then leads to rate cuts to stimulate the economy again.
This is a normal economic cycle, but its the depth and volatility of this current cycle that is the fearful part. With so much economic pain yet to be felt on top of already dismal lead indicators, the chance of an overshoot seems very high indeed.
And fixing home loans works in reverse too.
All of these loans that are coming due this year will again be locked in for 1, 2 or in some cases even 5 years. That’s going to prolong a lot of reduced economic activity.
Making things even worse at present is the “inverted yield curve”. In layman’s terms, this means that we’re in a rare period where short term rates are actually higher than long term rates (which is also a reliable predictor of an upcoming recession). Due to the fear of further rate increases and because it’s actually cheaper to fix longer a large number of borrowers then elect these longer terms, embedding the higher rate for longer.
The below graph shows this exact position, back in 2007, pre GFC.
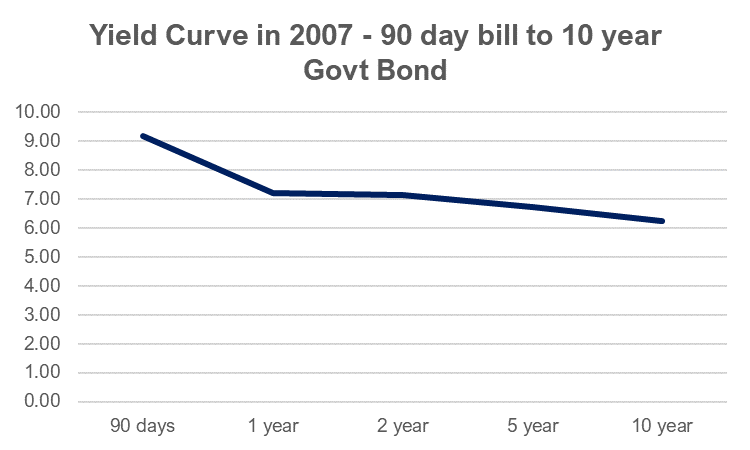
Two years later the 90 day bill was at 2.75%, 6.5% less.
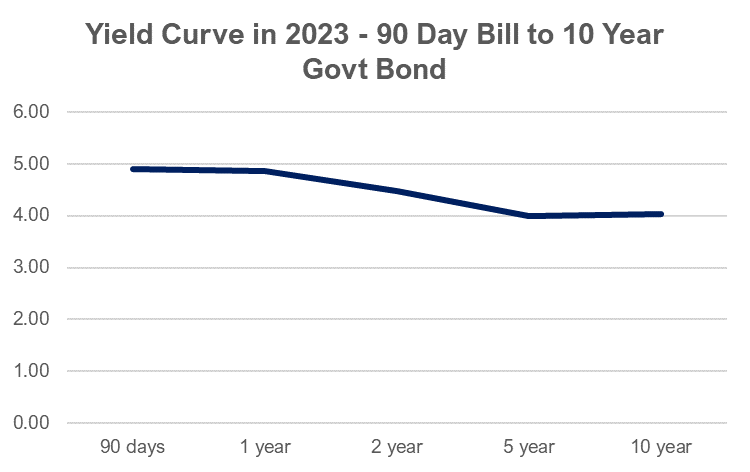
Now compare that to where we are today. Not quite as steep, but it does look similar, doesn’t it?
Now, please keep in mind this article does not take into account best practice risk management strategies. This is not a predictor for the future. History is not always a good guide for future results.
And all of this could be completely wrong if we’re not out of this inflation spiral yet.
But whatever the actual answer is, our current lagged methodology for setting rates based on historical data requires a rethink.
We would love to get your own views.
Who is NZAB?

Farming’s very complex and you can’t be an expert in everything. That’s why the best farmers gather a specialist team around them. Our specialty is better banking outcomes for our clients.
There’s no one better to work alongside you and your bank. With a deep understanding of your operation and our considerable banking expertise, we can give you the confidence and control to do what you do best.
We’ve been operating for over five years now and we’re right across New Zealand, For an introductory no cost chat, pick up the phone and talk directly to one of our specialists on 0800 NZAB 12.
Or if you prefer, Visit us at our website or email us directly on info@nzab.co.nz
