Our Insights

Budgeting For FY 24 is a Bit Like “No Man’s Land”

May 2, 2023 2:41:54 PM / by Andrew Laming posted in Debt, Action, Planning, Budget, Banking, Strategy

0 Comments

Information only disclaimer. The information and commentary in this email are provided for general information purposes only. We recommend the recipients seek financial advice about their circumstances from their adviser before making any financial or investment decision or taking any action.

With our clients we’re always in a continuous budget setting and forecasting mode so we can try and stay well ahead of what might happen and what impact it might have on key decisions. This can include debt repayment, capex projects, expansion feasibility and working capital facility management.

It would be fair to say that the last six months have been very difficult with significant downwardly revised income projections and costs still remaining sticky (and even increasing) on the back of inflation spiraling.

Going into FY 24, this is not going to get easier with a wide range of milk payout, meat and crop price expectations in the marketplace and rapidly changing macro events that may or may not flow through to on-farm input and capital costs.

With that intro out of the way, the following are some key thoughts as we move through the budgeting phase for FY 24.


First, what milk payout should we use?

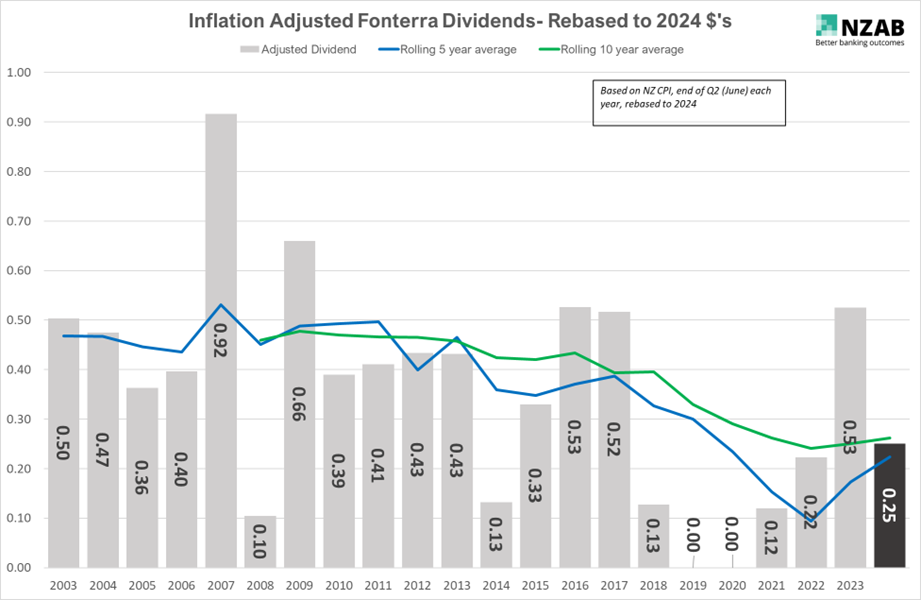
First of all, some data. Below is Fonterra payout, since 2010 with dividend on top. The yellow line is the five-year average, and the dark line is the ten year average.

Read More

The 2023 Dairy season. Where's the cash??

Feb 14, 2023 4:17:36 PM / by Scott Wishart posted in Debt, Action, Planning, Budget, Banking, Strategy

0 Comments

Last year we introduced our new analytics platform with some early insights as to what was going on with cost inflation in the dairy sector. That was really exciting for us and our clients as it provided real time information that could be used to understand what was going on and what was likely to happen next. It also proved useful for the banking sector and we had many positive and constructive meetings with banking teams where we collectively worked through understanding the information and planning to support our mutual clients.

After a good break over Christmas, one trend is now undeniable. Cash is disappearing. If you haven't yet revised your cashflow this season or found that your plans for tax, principal and business investment have had to change then you are certainly in the minority!

So, what's going on out there? The following charts are what we are seeing as things change on a monthly basis. 


Production is down on forecast:

Read More

The Inflation and Interest Rate Clusterf…

Jan 30, 2023 9:51:01 PM / by Andrew Laming posted in Debt, Action, Planning, Budget, Banking, Strategy

0 Comments


Information only disclaimer. The information and commentary in this email are provided for general information purposes only. We recommend the recipients seek financial advice about their circumstances from their adviser before making any financial or investment decision or taking any action.


That headline might get a few replies to my inbox. To add fuel to the fire, I need to be clear that I’m not an economist.

However, with the unprecedented volatility we’re seeing with both inflation and the resultant interest rates hikes designed to kill it, understanding the mechanics of inflation is critically important to establishing an informed (and not emotional) view on where interest rates might go.

In this article, I want to talk about how inflation is measured and the indicators that are used.   Plus, I want to discuss some of the flaws in the current approach which may lead into some of the unintended impacts that are going to be with us for years to come.


Why is this important?

It seems that both current inflation levels and the central bank response to it is like a large rubber band at present. The further it gets stretched away from the middle, the bigger the impact when it lets go. We’ve seen the impact of the far too loose monetary policy to date.

Are we set to see the pendulum swing too far again, but this time the other way?


Ok, first lets school up on inflation.  

Inflation, broadly occurs when demand for goods and services in the economy outpaces supply.  

Without going into detail, we all know that too much of it is a bad thing.   It’s colloquially called “the thief in your pocket”.

Get it right and it means households and business can have normal stable activity Get it wrong and it can lead to all sorts of market distortions and erratic behaviour for both business and consumers.  

Ultimately, a very high inflation rate puts a dent in the trust that people have in money – if people think it’s not going to be worth a similar amount in the future it starts to lose its “trust”.

Noone wants that to happen.


How is it calculated?

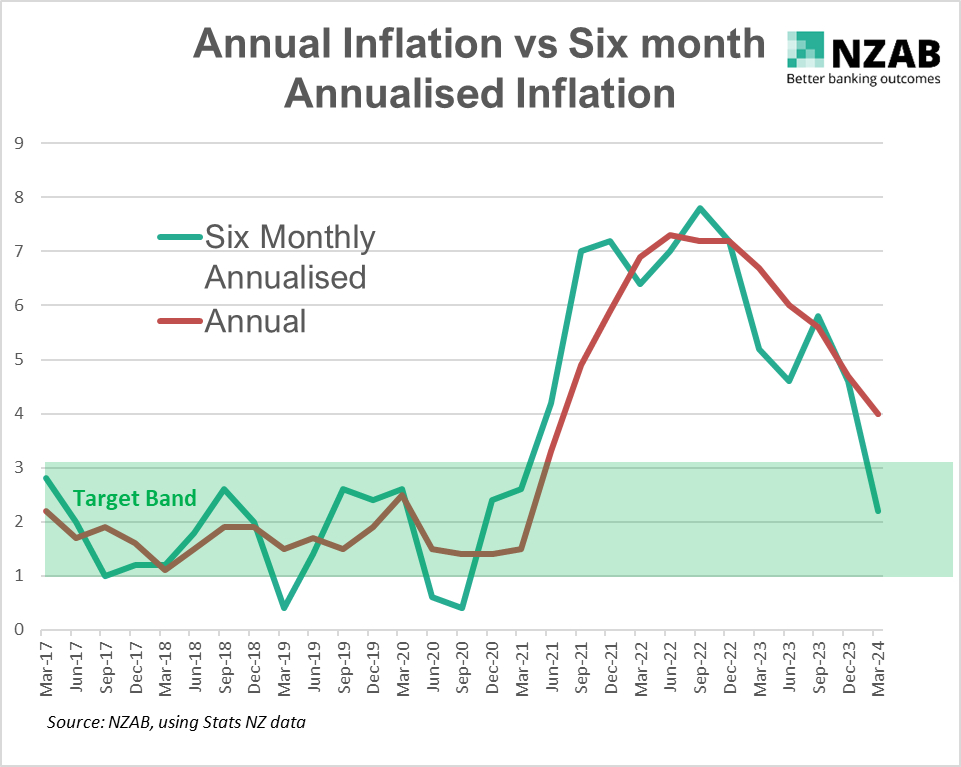
Inflation is calculated by examining a “basket” of goods and services and how they change in price over time. This might be food, petrol, rent or consumer electronics. This data is collected by Stats NZ and presented as a CPI index. At the moment, its running at 7.2% well above the mandated band of the RBNZ of 1-3%.


Issue one: CPI is measured over a 90-day period (quarterly) and looks backwards.  

We’ve just been informed by Stats NZ in late January, that CPI for the quarter ending December 2022 was 7.2%. That’s all of the spending change in October, November and December last year.

In October last year households were paying an average of only 4.07% on their home lending (due to still having fixed rates in place – see more on this below). Household savings were still semi-high and Adrian Orr hadn’t delivered his November monetary statement reprimanding public spending and talking of significant further increases in rates.  

In other words, people hadn’t changed much at this point.

In other countries such as the US, CPI is measured monthly - we think adopting this system would be a very good start.


Issue two: CPI doesn’t record change of volume of spend - only a change in price.

What’s really interesting about the calculation methodology is that it measures the changes in price of particular goods or services, but it doesn’t measure the change in volume of how many or how much we’re purchasing them for.   They are weighted, but that weighting only changes every few years.

For example, if food prices (which make up ~19% of the index) go up for the year by 10% but we all collectively spend 10% less because we can’t afford as much (meaning purchasing volume goes down), this registers as a 10% increase in inflation (for that category) even though we may have spent the entire amount.

Now economic theory solves for this – i.e if we are all start buying less of something that costs more, that, “in theory”, with all else held equal, might lead to a build-up of stock of that item which would then mean that prices would go down to bring supply and demand back into equilibrium *

But that takes time to work through- again, “a lag”.

(* this statement is not entirely correct when it comes to food at present – as inventory itself won’t build if the actual supply has reduced – which is currently the case with food due to Covid issues and geo-political supply line disruption)


Issue three - fixed rates - average interest rates on home loans are still low (but rising fast).

About 50% of all fixed rate loans will come off this year.

At the moment (as of Nov 2022), the average rate being paid given a mix of historical fixed rates, is still only 4.07%.   We estimate it is probably about 4.50% by the end of January – but that is still a mile away from the current short term re-fix rate of 6.50%. In short, the pain and impact on spending in the economy is still coming and set to intensify.

Given the high use of fixed rates by New Zealand homeowners, albeit quite short in length (1-3 years), you could effectively put up the OCR to 10% and it wouldn’t make much difference to how much a homeowner is paying on interest right now.

This comment is an extreme example, as it would definitely have the impact of scaring the population into spending less due to fear of the future – but the point is that it takes time for the increase in OCR to work its way into actual spending habits. You must be patient to see its effects as it flows through the fixed curve.

However, the impact is happening much quicker in farming and in business where loans are typically more likely to be floating commercial type products and they see the rises everywhere, the 30 or 90 day bill goes up. They are feeling it sooner.

Read More

Latest Edition: The NZAB Agri Bank Dashboard - December 2022

Dec 14, 2022 3:19:57 PM / by Andrew Laming posted in Debt, Action, Planning, Budget, Banking, Strategy

0 Comments


With the RBNZ recently sharing updated bank metrics for the period ending 30 September 2022, its time for us to dive back in and see what movements are afoot.

Welcome to the latest edition of our NZAB Bank Dashboard.

For the first time in a long time we're starting to see some slowing in all sector credit growth with the September quarter being the slowest growth in new lending since the June 2020 quarter. 

Whilst the growth has slowed; it was nevertheless up with $3.5bn up for the quarter and $23bn for the year.  Very interestingly, ANZ, the largest lender in NZ, recorded none of that growth in part due to much less home lending and their agri book retrenching almost 5% for the year.  Overall agri loan growth is largely neutral with ongoing dairy repayments outweighing some strong growth in Horticulture (nearly 16% up year on year).

Whilst ANZ agri market share continues to slide unabated, at 1% per year, ASB also lost ground, shedding almost 60bps of market share for the year ended September.  

On the flipside, BNZ gained what ASB has lost- gaining 0.58% market share and Rabo gained what ANZ lost- at 0.98%.   These are quite big movements indeed and are likely to drive a lot of activity at market level as all banks continue to compete for new business in the sector.     


As always, if you have any questions, please contact us directly.


Read More

Learn to Spot Credit Cycles, or Suffer the Consequences

Nov 23, 2022 4:50:20 PM / by Andrew Laming posted in Debt, Action, Planning, Budget, Banking, Strategy

0 Comments


In our last article, we talked about the evident return of bank credit appetite in the Agriculture sector, a welcome development for farmers as capital availability is important for both increasing productivity and confidence in the sector.   Both are good things, and they encourage further investment plus ensure that talent is attracted to the sector, critical for future success.

In this article, Scott Wishart and I came together to collaborate on a new article to broaden the discussion and talk about the observed credit cycle in agriculture – what causes it and what to look for.

This is important to understand as these cycles are much shorter than the investment period of a farming business. In other words, it’s not uncommon to see less than 3-5 years from peak to the trough of a credit cycle - yet the investment in farming is generational and needs to outlive both the top and the bottom of these peaks.

The causes are not always the same either. Sometimes it’s due to the lack of sustained profitability in the sector, other times it might be a generalised credit crunch. Sometimes like we saw in 2016 onwards, it was increased regulatory capital requirements making agriculture loans less profitable. 

In other times it’s sector weighting versus other sectors in that bank, or even at the parent bank. An example of this that we’re seeing playing out right now is where one sector (housing) is becoming “full” for the bank and where another sector (agriculture) has loans that are getting repaid faster than they are growing creating a positive supply gap of credit.

Learning how to spot the early signs of change and what drives these changes is critical when making your investment decisions. Sticking to rigorous behaviours with business management and decisioning is key.


The cycle can be best represented by a sine wave as follows:

Read More

Big Mismatch in Agri Credit Availability and Demand is Stoking Credit Appetite

Oct 28, 2022 2:26:15 PM / by Andrew Laming posted in Debt, Action, Planning, Budget, Banking, Strategy

0 Comments


Predicting the future isn’t easy and “anyone that tells you that they know what’s going to happen is either lying or they don’t know what they’re talking about” (*Warren Buffet).

That said, how people feel about the future based on their observations right now is really interesting and it can tell us a lot about what will play out in coming months.  

Survey’s are a good way of examining these trends


One survey we watch really closely is the RBNZ Credit Conditions Survey, published bi-annually.

This survey is relatively simple - the RBNZ asks banks what they expect both the demand and supply of credit in each of their lending sectors (residential, consumer, SME, Agri, Corporate) will be over the next six months and what they've observed over the last six months.     

They are sentiment-based questions but given the banks do control the strings of sector capital availability, its pays to take notice.

There’s a bit of data in the survey, but the subset that describes things best is the rolling three year average of credit availability - in other words- how does credit availability stack up today verse three years ago as a trend line.   


We’ve taken that data and put it into the graph below - the results are starting to show some very stark trends between the different sectors which are worth paying attention to.

Read More

Farm Costs Can Go Down Too!

Oct 7, 2022 9:35:17 AM / by Andrew Laming posted in Debt, Action, Planning, Budget, Banking, Strategy

0 Comments

We penned an article a couple of weeks ago looking at how dairy EBIT margins since 1999 had been performing. You can find that article here.  In it, we observed that margins were steadily increasing over time, moving from $2.00 to $2.50 per KgMS on a rolling ten-year average. Further, the analysis showed that at last year’s payout of $9.30, it was likely to have been our best ever margin (to date. Watch this space!)

Historical financial data is a significant part of the credit process – not just to measure how well a farmer has performed in the past, but also how they’re likely to respond under stress.

Read More

NZAB Welcomes New Partners

Sep 22, 2022 10:10:28 PM / by Scott Wishart posted in Debt, Action, Planning, Budget, Banking, Strategy

0 Comments

It gives me great delight to announce that Nick Bell, Chris Laming, Mike Parr and Michael McKenzie have joined the founders of NZAB in becoming part owners. 

At NZAB, we have sought to create to create an environment where the best bankers and business professionals can find a home, working directly for the farmer. We wanted them to stay deeply involved and grow commercially with the sector, deploying their significant experience for the benefit of the farmer.  

Since we started NZAB, we have had a strategy to create a culture and a business model that allows those who believe what we believe to invest and grow alongside our vision. It's exciting to see that start to come to fruition. 

Over time, we want more of our staff to do the same so they can continue to come to work each day feeling even more empowered to help their farmers get what they deserve. 


Please join us in congratulating Nick, Chris, Mike and Michael!

In doing so, we thank you for your support. Without your ongoing business, or you telling your other farming peers about us, we wouldn’t be where we are today.

For those of you that don’t know them, you can find out a bit more about these great people below.

Read More

In Such Volatile Economic Times, What Represents a Good Payout?

Sep 16, 2022 2:19:24 PM / by Andrew Laming posted in Debt, Action, Planning, Budget, Banking, Strategy

0 Comments

The economic world has been in a state of flux over the last 12 months with significant changes in both product prices and the cost of production.

In the agriculture sector it has been no different with large cost increases in FY 22, but correspondingly large lifts in product prices as well. You can see a bit more about the FY 22 year in review from our own dataset in this article.

In FY 22, we extracted actual data from our New Zealand wide customer database which showed operating costs had a significant lift from the year before of around 15%, well above the NZ CPI rate for the same period of 6.9%.

But that change in cost didn’t stop at the end of FY 22.  

This week, we’ve surveyed our Client Directors across New Zealand to see where their customer budgets are landing for FY 23. As you might expect, that range is relatively significant, from $5 per KgMS to $7.20. However, the average is landing at $6.25 per KgMS before depreciation.


So whilst the dairy sector is “enjoying” record payouts, the devil, as they say, is very much in the detail.

To add some further data to this anecdote, we’ve put together the graph below which examines how dairy EBIT per KgMS has been trending over the last 20+ years. The data is sourced from Dairy NZ’s economic data since 1999 to 2021. For FY 22 we’ve used our own data set and for FY 23 we’ve used a $9 cashflow payout less our surveyed average cost of $6.25 above (plus an allowance for depreciation).

Read More

The Results from the RBNZ Policies During Covid Are In – And We Shouldn’t Be Surprised.

Sep 5, 2022 7:39:18 PM / by Andrew Laming posted in Debt, Action, Planning, Budget, Banking, Strategy

0 Comments

Information only disclaimer. The information and commentary in this email are provided for general information purposes only. We recommend the recipients seek financial advice about their circumstances from their adviser before making any financial or investment decision or taking any action.

With the RBNZ about to embark on their five-yearly review, which follows a report titled How Central Bank Mistakes after 2019 Led to Inflation, we thought we’d add our small voice to the conversation.

If you recall, the RBNZ went in to bat (with a very big bat) during Covid to ensure the economy didn’t tip over and the credit/banking system remained functional.  

It did this with three broad tools:

  1. Aggressively cut the “OCR” to stimulate borrowing (this is “Reserve Bank 101” for stimulating an economy during shock or recession).
  2. Devised and then embarked on the “LSAP” (Large Scale Asset Purchase Programme) – this is a sophisticated way of saying “printing money” as the RBNZ purchased government bonds in the secondary market to stimulate more purchasing demand for newly released (and additional) government bonds – to support new government spending during this time.
  3. Devised and then embarked on the FLP (Funding for Lending Programme) – where the banks had access to large additional facilities at RBNZ at the cost of the OCR at the time.

All of these had the impact of providing a significant amount of new money into the banking sector.

What wasn't thought about at the time, was how the banks would then use that money.

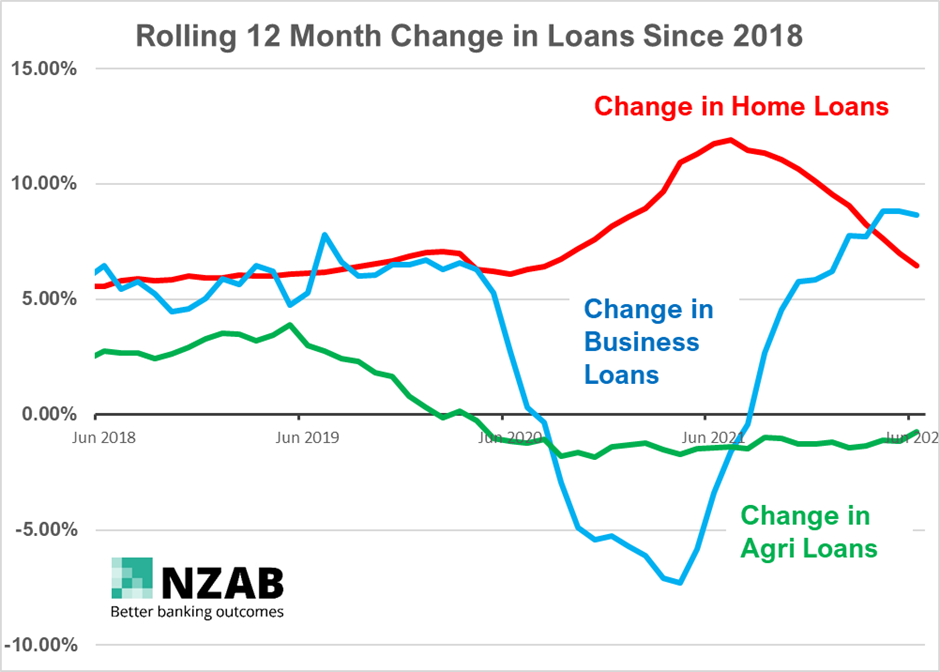
The graph below shows the rolling 12 month change in Home, Business and Agriculture lending, with source data from RBNZ. It covers the period before, during and after those programmes.

Read More