
Information only disclaimer. The information and commentary in this email are provided for general information purposes only. We recommend the recipients seek financial advice about their circumstances from their adviser before making any financial or investment decision or taking any action.
We’ve dived back into the RBNZ data to see all the main bank movements over the last six months (to 30 June 2025) - all the changes in lending, who’s winning market share and who’s losing it - in both the Agri and Business Lending Sectors.
This dashboard summarises lending trends across New Zealand’s registered banks to 30 June 2025, based on RBNZ data and NZAB’s market intelligence. It provides a comparative view of total, agri, and business credit movements, market share shifts, and provisioning patterns.
The 12-month period to June 2025 marked a stabilisation phase following two years of sharp monetary tightening. Aggregate bank lending grew by nearly 4% , but that growth was uneven across sectors and lenders. Housing continued to dominate system expansion, while agricultural credit remained flat and business lending advanced modestly.
For agriculture, a slight rebound in dairy and horticultural lending during the second half of the year masked a full-year contraction, reflecting both seasonal working-capital cycles and ongoing deleveraging on the back of strong sector performance. Meanwhile, Westpac and ANZ continued to retreat from agri exposure, with BNZ, ASB, and Rabobank filling the gap.
In business lending, Kiwibank and ASB were the most aggressive lenders, each gaining about half a percent in market share, reinforcing Kiwbank’s ongoing challenger moniker.
Overall, the data highlights a system still cautious on productive-sector credit despite improving farm profitability and moderating risk indicators. Provisioning levels across the agri portfolios declined, consistent with stronger commodity prices and stable repayment behaviour.
This report builds on NZAB’s prior dashboards and provides a factual base for ongoing commentary on capital allocation, bank behaviour, and funding conditions across New Zealand’s rural economy.
With this version, we've also included all of the respective banks' "group" exposures- additional lending that the banks complete in NZ directly from their parent entities.
As always, if you have any questions, or would like a full digital copy of the data, please email me directly.
(*Note: "other" includes SBS, TSB, Co-op Bank, ICBC, BOC, BOB and BOI, and includes all "group exposures" )
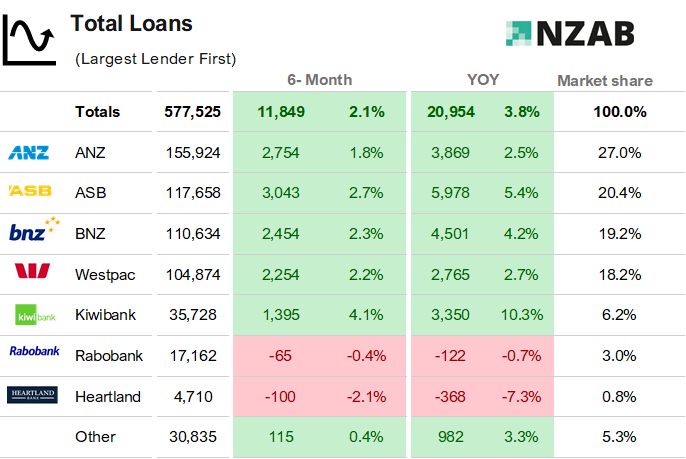
Credit growth has been picking up – with nearly 4% growth over the last 12 months.
Three standouts in the total loan growth data:
1. Kiwibank’s continued system growth of >10%, accelerating from when we last reported (~9%) and almost three times the average. That’s materially significant and continues their reputation of living up to the "challenger bank“ label bestowed upon them by the government
2. ASB growth has accelerated from a near stall six months ago.
3. Heartland have suffered a very material drop in lending volumes (-7.3% YOY), completely against the grain of their competitors with the reduction in lending volumes coming from both their business and housing portfolios. Heartland’s contraction aligns with reduced motor and reverse-mortgage origination volumes faced since 2024.
(*Note: "other" includes SBS, TSB, Co-op Bank, ICBC, BOC, BOB and BOI ).
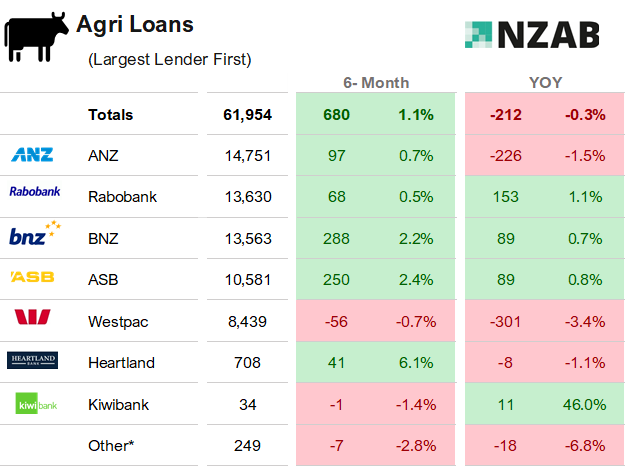
Whilst the year on year (“YOY”) growth in Agri debt is relatively muted, it was a game of two halves as credit grew a little more meaningfully in the last 6 months. Some of this is seasonal and related to farm settlements.
The bulk of this was in dairy growth (up $455m for last six months, but actually down for the 12 months) and horticulture (up $216m for last 6 months). The dairy numbers will take a big hit in the next six months- the proposed Fonterra distribution will have a material impact on this.
There was another notable retraction at Westpac, down over 3% for the year (a continuation of a theme seen in our last few dashboards), and a continual slide for ANZ.
Combined with ANZ's moderate overall total loan growth (up 2.5%) and ANZ's retraction in business lending in the next graph, their relative preference for funding housing over the business and agriculture sectors continues.
ASB and BNZ have been both notable in the last six months with growth from some bigger drawdowns in June.
It’s important to note the context here. In the last 12 months, total NZ lending from registered banks grew >$20bn (largely housing), whereas Agri lending growth was largely nil and business (upcoming graph) was up $1.8bn.
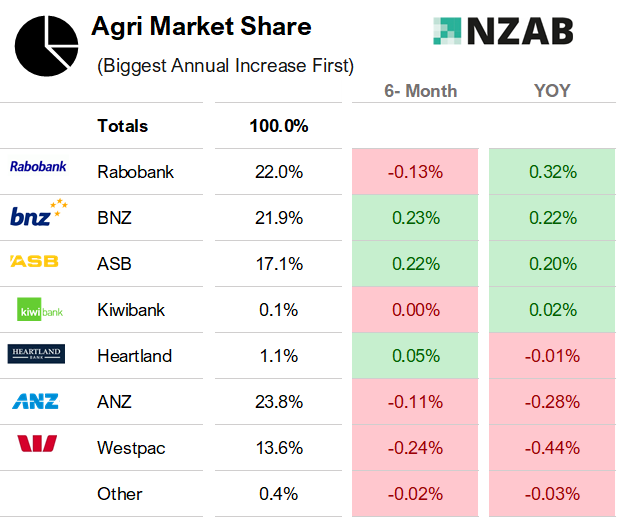
Familiar trends here again with Rabobank continuing to rise and ANZ & Westpac retreating. Notable is BNZ and ASB consistent growth alongside though as well.
Westpac showed the largest reduction in market share, down 44bps, continuing on from the last report that saw them lose 60bps.
(*note the difference in Agri loan total data vs split bank data above due to other non - registered bank lenders not being in bank split data)
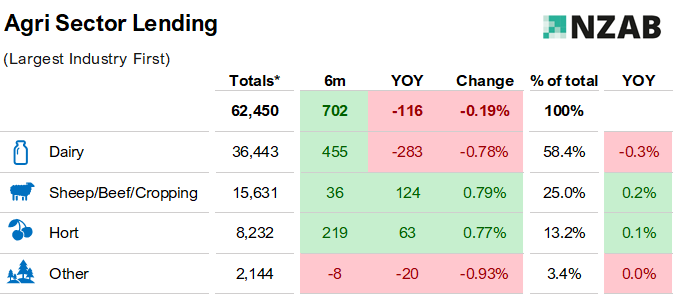
Despite significant lender appetite, growth in dairy debt remains largely non existent – with strong returns not yet being capitalised into new borrowing projects. The trend line is expected to continue downwards – even with higher land prices being paid and dairy conversion being funded, the proposed distribution/repayment from Fonterra is likely to eclipse this.
Sheep and beef debt was expected to grow further given the painful tail of poor 2023/24 returns - however this has been very well controlled. That said, we suspect there will be more debt sitting in non traditional places such as livestock funders and the like.
Horticulture growth has flattened notably versus previously significant increase – we are noting more reticence from lenders in this area given some higher profile losses and legacy losses stemming from Cyclone Gabrielle.
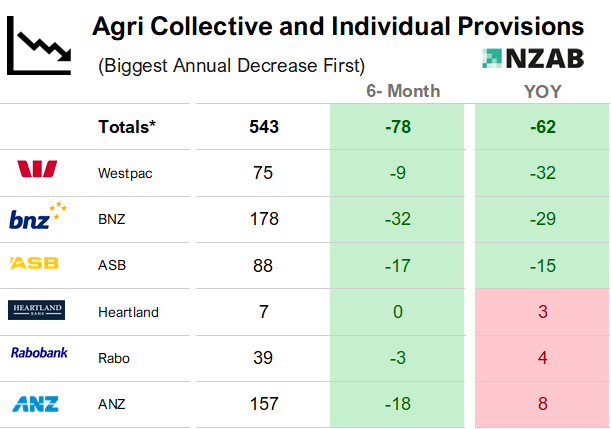
*Note Kiwibank and Other not included for materiality reasons. This data sums both individual and collective provisions for each bank.
Individual provisions are where Bank's have identified a certain loan where they believe they will lose an estimated dollar amount on.
Collective provisions are a blanket "allowance" over a bank's entire lending book and is a normally a function of the combined risk rating of their entire portfolio. If CP's go up, then risk has deteriorated and vice versa. This makes up a greater amount of the overall provisions and is more theoretical.
Across the entire sector, there is only $85m of individual provisions and the vast majority of those are held with one bank- BNZ - with $55m.
In the last six and 12 months respectively, agri provisions have been improving- probably unsurprising given improving fortunes in the red meat sector and ongoing dairy strength.
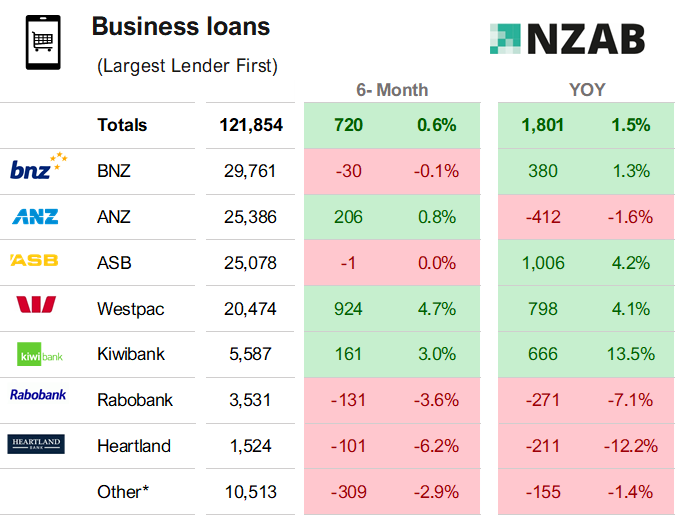
(*Note: "other" includes SBS, and TSB, Co-op Bank, ICBC, BOC, BOB and BOI ).
Year-on-year business lending growth was a little more enthusiastic, but still sits well under 50% of the rate of total NZ loan growth.
Westpac accounts for nearly all of the last six months growth with almost $1bn in new business lending- a significant increase (although this could stem from a few large syndications in infrastructure or utilities rather than broad growth).
But the data is lumpy - as Kiwibank has been exceptionally strong (likely via digital origination) when looking across the entire 12 months (and to a lesser extent, ASB).
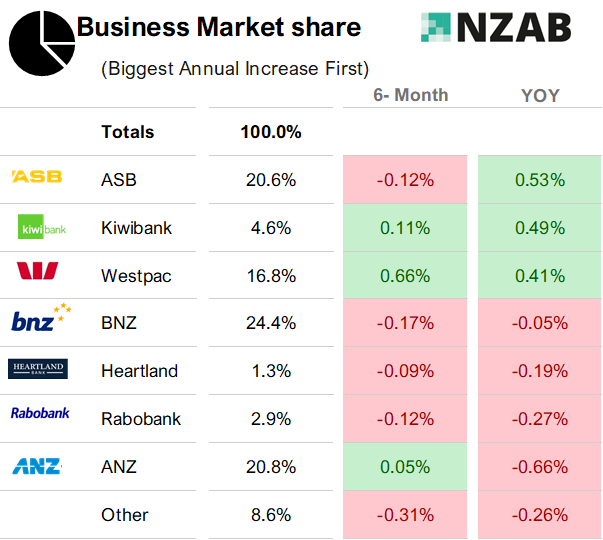
ASB and Kiwibank the big movers over the last 12 months, picking up ~0.5% each in market share.
The biggest reduction- was from ANZ, shedding 66bps of market share – but then noting the turnaround in the last six months.
Who is NZAB?
.png?width=840&height=308&name=NZAB%20FLYER%20(1).png)
Turning Strategy into Action
At NZAB, we’re already putting our principles into practice by building pathways for more funding and equity options to reach New Zealand farming, to support productivity increase, investment into technology, business expansion and intergenerational change.
Our advisory model is built around helping clients become ‘Capital ready’ whether that means securing bank debt, attracting equity partners, or designing hybrid structures that blend both. We’re also focused on improving farmers’ access to competitive capital from the main banks by presenting their businesses in the proper light, highlighting their innovative strategy, management of risk, on farm performance and future wealth creation. This is the practical side of rewiring the capital system turning strategy into execution.
In the meantime, if you’ve got a great idea or a financing need, drop us a line - no one else in the market has the same access, insight, or structuring capability to connect capital with opportunity the way we do, so drop us an email or ring us on 0800 NZAB12
Please feel free to share this newsletter with anyone you think may benefit from the content. You are also able to connect with us using the social media platforms below.
|
|
|
|
NZAB, 335 Lincoln Road, Addington, Christchurch, New Zealand 8024, 0800 NZAB 12
Unsubscribe Manage preferences
