Overall, over the last six months, Agri debt went down over $1.0bn.
Whilst that shows incredibly strong discipline from farming businesses, this is not new news and it’s a continuation of the trend we started seeing last year. Although great to see it still happening.
It becomes even more compelling though when you see that total loans (i.e. all consumer, home, business, commercial, Agri) grew by a whopping $11.0bn over the same period. In other words, Agri is doing the heavy lifting when it comes to paying back debt in NZ. Well done to all farmers, but we still would like to see that capital recycled back into the sector into productive investment
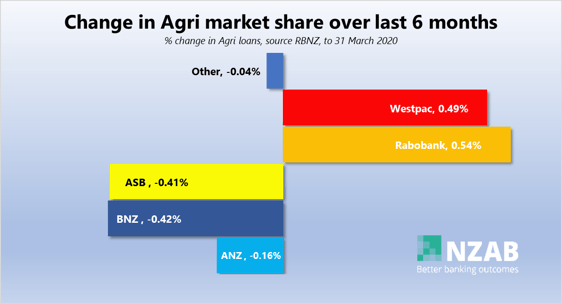
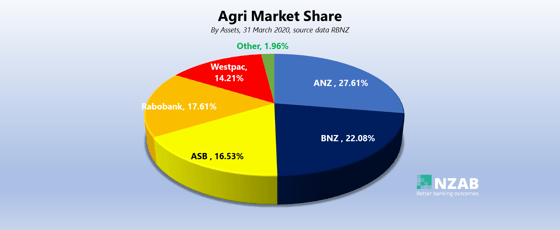
Agri Market share overall stays relatively the same between banks with ANZ still the largest share.
ASB has now slipped into 4th place, behind Rabobank
|
|
What is interesting is the change in market share.
BNZ and ASB are both the big movers downwards, shedding over 40bps of market share each. Translating that into real numbers, they have shed over $400-$550m in Agri Loans, each, during the last 6 months.
The big growers continue to be Rabo and Westpac, although keep in mind this data is now aged (an example here is that we’re seeing ASB increasing their market presence significantly of late, perhaps in “reaction” to some of this data).
ANZ, continue to hold flat.
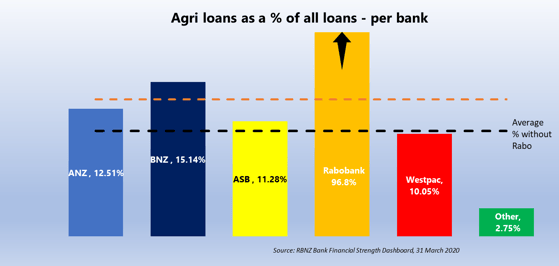
The next one is an interesting graph – it shows how many Agri Loans a bank has, out of all of its loans. Why is this important? Well sometimes, if a bank is “overweight” in a sector versus is peers, it can impact lending appetite.
This graph takes into account that relative size of each bank.
A good example here is that whilst ANZ has the largest market share of Agri, they have only a market average % of Agri loans as a % of their entire book. At the other end of the spectrum, BNZ has more Agri loans as a % of theirs. Rabo is an Agri only lender so we have included an average line with and without them in the data set.
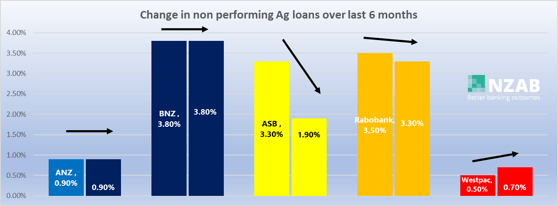
And lastly, we also look at the change in non-performing loans. No change really in the last 6 months, apart from ASB with a significant change downwards
The fact that Agri non-performing loans overall has not gone up (it has gone down), is also good thing
And one final thought, where are the challenger banks for this gap forming in Agri Banking? With banks clearly increasing their lending to NZ overall, but Agri Bank debt declining within that, we ask the question- who’s going to step up and take a slice of NZ’s biggest export earner (* as of recent data, NZ primary exports has now re-overtaken tourism as NZ’s biggest earner)?
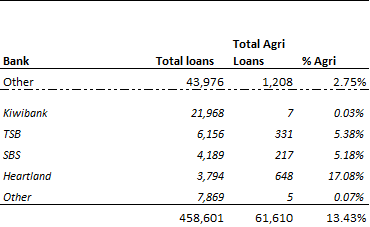
The below table is the “other registered banks” that operate in NZ. Overall, they have $44bn lent out of which only $1.2bn is into Agri – a paltry 2.75% of their loan books
Where is Kiwibank with their Agri strategy? Where are the new entrants into this sector? All very good questions we think.
Any other questions you might have on any of the data, please PM us directly.
|