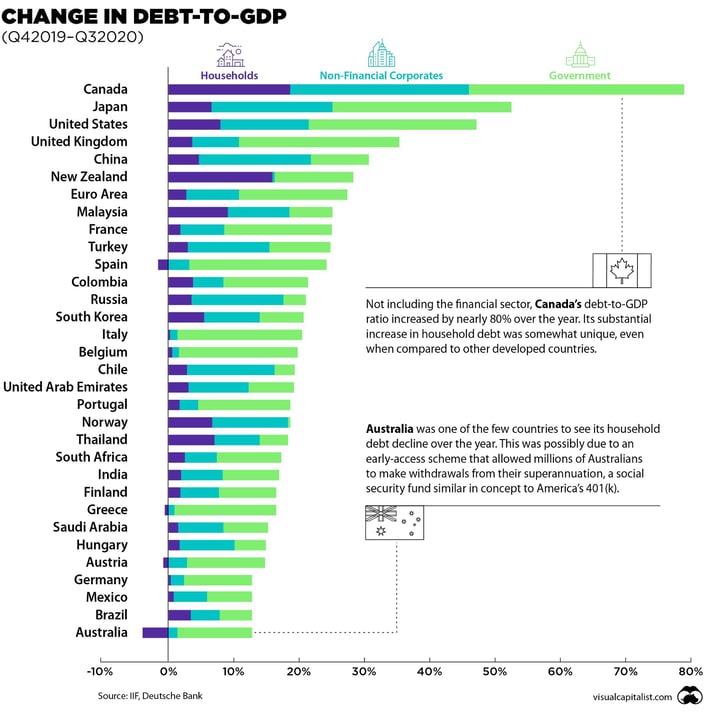
Above is an exceptional graph (courtesy of visualcapitalist.com) highlighting the relative change in world debt, country by country, over the last 12 months - broken into household, commercial and government.
The change in debt is further broken into where its going - Government, household or "non-financial corporates" (Business and Agri)
Putting aside the ramp up in overall debt- have a look where it’s going and where it’s not.
Apart from government debt- it’s all going into household debt (the purple line) and virtually none into commercial/business (light blue line).
Contrast that with the rest of the world and the increase in business debt investment.
We seem to lead the work in pumping debt into households and lag the world with capital support to business.
All of that investment being made by other countries' banking systems into their business communities will show up later in sustainable GDP growth - where will our splurge on housing go?
We know why this is happening- NZ capital regulatory rules that favour lending to households and disincentivise lending to Commercial and Agri business, plus an apparent desire from some NZ Banks to put shorter term, easier profit ahead of longer term "NZ Inc" strategy.
So c’mon RBNZ and NZ banks - this needs to be fixed for our business and farming community or we face falling behind.
